JetBlue Airlines 2008 Annual Report Download - page 38
Download and view the complete annual report
Please find page 38 of the 2008 JetBlue Airlines annual report below. You can navigate through the pages in the report by either clicking on the pages listed below, or by using the keyword search tool below to find specific information within the annual report.-
 1
1 -
2
-
3
-
4
-
5
-
6
-
7
-
8
-
9
-
10
-
11
-
12
-
13
-
14
-
15
-
16
-
17
-
18
-
19
-
20
-
21
-
22
-
23
-
24
-
25
-
26
-
27
-
 28
28 -
 29
29 -
 30
30 -
 31
31 -
 32
32 -
 33
33 -
 34
34 -
 35
35 -
 36
36 -
 37
37 -
 38
38 -
 39
39 -
 40
40 -
 41
41 -
 42
42 -
 43
43 -
 44
44 -
 45
45 -
 46
46 -
 47
47 -
 48
48 -
49
-
50
-
51
-
52
-
53
-
54
-
55
-
56
-
57
-
58
-
59
-
60
-
61
-
62
-
63
-
64
-
65
-
66
-
67
-
68
-
69
-
70
-
71
-
72
-
73
-
74
-
75
-
76
-
77
-
78
-
79
-
80
-
81
-
82
-
83
-
84
-
85
-
86
-
87
-
88
-
89
-
90
-
91
-
92
-
93
-
94
-
95
-
96
-
97
-
98
-
99
-
100
-
101
-
102
-
103
-
104
-
105
-
106
-
107
-
108
-
109
-
110
 |
 |

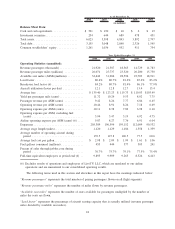
Operating Revenues. Operating revenues increased 19%, or $546 million, primarily due to an increase
in passenger revenues. The $420 million increase in passenger revenues was attributable to a 14% increase in
yield due to higher average fare offset by a slightly lower load factor. Passenger revenues were also higher due
to a 5% increase in departures. Included in passenger revenues are the fees collected from passengers related
to our new EML product upgrade.
Other revenue increased 61%, or $126 million, primarily due to higher change fees and excess baggage
fees of $68 million resulting from more passengers, the introduction of the second checked bag fee in 2008,
and increased change fee rates. Other revenue also increased due to higher LiveTV third-party revenues, rental
income, mail revenues, in-flight sales, and the marketing component of TrueBlue point sales.
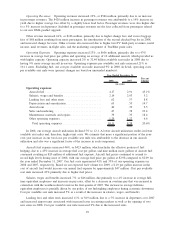
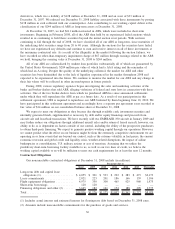
Operating Expenses. Operating expenses increased 23%, or $606 million, primarily due to a 43%
increase in average fuel price per gallon and operating an average of 12 additional aircraft, which provided us
with higher capacity. Operating capacity increased 2% to 32.44 billion available seat miles in 2008 due to
having 9% more average aircraft in-service. Operating expenses per available seat mile increased 21% to
10.11 cents. Excluding fuel, our cost per available seat mile increased 9% in 2008. In detail, operating costs
per available seat mile were (percent changes are based on unrounded numbers):
2008 2007
Percent
Change
Year Ended December 31,
(in cents)
Operating expenses:
Aircraft fuel ................................... 4.17 2.91 43.1%
Salaries, wages and benefits ....................... 2.14 2.03 5.2
Landing fees and other rents ....................... .62 .57 8.8
Depreciation and amortization ...................... .63 .55 14.7
Aircraft rent ................................... .40 .39 2.5
Sales and marketing ............................. .47 .38 23.4
Maintenance materials and repairs ................... .39 .33 18.4
Other operating expenses.......................... 1.29 1.22 6.6
Total operating expenses ........................ 10.11 8.38 20.6%
In 2008, our average aircraft utilization declined 5% to 12.1. A lower aircraft utilization results in fewer
available seat miles and, therefore, higher unit costs. We estimate that more a significant portion of the year-
over-year increase in our total cost per available seat mile was attributable to the decrease in our aircraft
utilization and also was a significant factor of the increase in each component.
Aircraft fuel expense increased 46%, or $423 million, which includes the effective portion of fuel
hedging, due to a 43% increase in average fuel cost per gallon, and nine million more gallons of aircraft fuel
consumed resulting in $20 million of additional fuel expense. Aircraft fuel prices continued to ascend to
record high levels during most of 2008, with our average fuel price per gallon at $2.98 compared to $2.09 for
the year ended December 31, 2007. Our fuel costs represented 41% and 35% of our operating expenses in
2008 and 2007, respectively. Based on our expected fuel volume for 2009, a $.10 per gallon increase in the
cost of aircraft fuel would increase our annual fuel expense by approximately $47 million. Cost per available
seat mile increased 43% primarily due to higher fuel prices.
Salaries, wages and benefits increased 7%, or $46 million, due primarily to a 4% increase in average full-
time equivalent employees and increases in pay rates, offset by a decrease in overtime pay that was incurred in
connection with the weather-related events in the first quarter of 2007. The increase in average full-time
equivalent employees is partially driven by our policy of not furloughing employees during economic downturns.
Cost per available seat mile increased 5% as a result of the increases in salaries, wages, and benefits
Landing fees and other rents increased 11%, or $19 million, due to a 5% increase in departures over 2007
and increased airport rents associated with increased rates in existing markets as well as the opening of two
new cities in 2008. Cost per available seat mile increased 9% due to the increased rents.
29