JetBlue Airlines 2008 Annual Report Download - page 33
Download and view the complete annual report
Please find page 33 of the 2008 JetBlue Airlines annual report below. You can navigate through the pages in the report by either clicking on the pages listed below, or by using the keyword search tool below to find specific information within the annual report.-
 1
1 -
2
-
3
-
4
-
5
-
6
-
7
-
8
-
9
-
10
-
11
-
12
-
13
-
14
-
15
-
16
-
17
-
18
-
19
-
20
-
21
-
22
-
 23
23 -
 24
24 -
 25
25 -
 26
26 -
 27
27 -
 28
28 -
 29
29 -
 30
30 -
 31
31 -
 32
32 -
 33
33 -
 34
34 -
 35
35 -
 36
36 -
 37
37 -
 38
38 -
 39
39 -
 40
40 -
 41
41 -
 42
42 -
 43
43 -
44
-
45
-
46
-
47
-
48
-
49
-
50
-
51
-
52
-
53
-
54
-
55
-
56
-
57
-
58
-
59
-
60
-
61
-
62
-
63
-
64
-
65
-
66
-
67
-
68
-
69
-
70
-
71
-
72
-
73
-
74
-
75
-
76
-
77
-
78
-
79
-
80
-
81
-
82
-
83
-
84
-
85
-
86
-
87
-
88
-
89
-
90
-
91
-
92
-
93
-
94
-
95
-
96
-
97
-
98
-
99
-
100
-
101
-
102
-
103
-
104
-
105
-
106
-
107
-
108
-
109
-
110
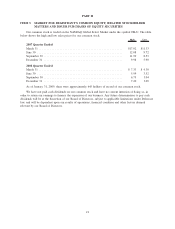
 |
 |

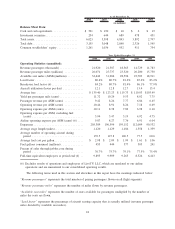
2008 2007 2006 2005 2004
As of December 31,
(in millions)
Balance Sheet Data:
Cash and cash equivalents ................ $ 561 $ 190 $ 10 $ 6 $ 19
Investment securities .................... 254 644 689 478 431
Total assets........................... 6,023 5,598 4,843 3,892 2,797
Total debt ............................ 3,155 3,048 2,840 2,326 1,545
Common stockholders’ equity ............. 1,261 1,036 952 911 754
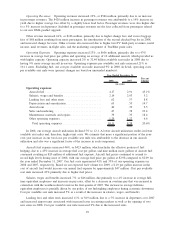
2008 2007 2006 2005 2004
Year Ended December 31,
Operating Statistics (unaudited):
Revenue passengers (thousands) ............... 21,920 21,387 18,565 14,729 11,783
Revenue passenger miles (millions) ............ 26,071 25,737 23,320 20,200 15,730
Available seat miles (ASMs)(millions) .......... 32,442 31,904 28,594 23,703 18,911
Load factor .............................. 80.4% 80.7% 81.6% 85.2% 83.2%
Breakeven load factor (6) . . .................. 84.2% 80.7% 81.4% 86.1% 77.9%
Aircraft utilization (hours per day) ............. 12.1 12.8 12.7 13.4 13.4
Average fare ............................. $ 139.40 $ 123.23 $ 119.73 $ 110.03 $103.49
Yield per passenger mile (cents) ............... 11.72 10.24 9.53 8.02 7.75
Passenger revenue per ASM (cents) ............ 9.42 8.26 7.77 6.84 6.45
Operating revenue per ASM (cents) ............ 10.44 8.91 8.26 7.18 6.69
Operating expense per ASM (cents) ............ 10.11 8.38 7.82 6.98 6.10
Operating expense per ASM, excluding fuel
(cents) ................................ 5.94 5.47 5.19 4.92 4.75
Airline operating expense per ASM (cents) (6) .... 9.87 8.27 7.76 6.91 6.04
Departures ............................... 205,389 196,594 159,152 112,009 90,532
Average stage length (miles).................. 1,120 1,129 1,186 1,358 1,339
Average number of operating aircraft during
period ................................ 139.5 127.8 106.5 77.5 60.6
Average fuel cost per gallon .................. $ 2.98 $ 2.09 $ 1.99 $ 1.61 $ 1.06
Fuel gallons consumed (millions) .............. 453 444 377 303 241
Percent of sales through jetblue.com during
period ................................ 76.7% 75.7% 79.1% 77.5% 75.4%
Full-time equivalent employees at period end (6) . . 9,895 9,909 9,265 8,326 6,413
(6) Excludes results of operations and employees of LiveTV, LLC, which are unrelated to our airline
operations and are immaterial to our consolidated operating results.
The following terms used in this section and elsewhere in this report have the meanings indicated below:
“Revenue passengers” represents the total number of paying passengers flown on all flight segments.
“Revenue passenger miles” represents the number of miles flown by revenue passengers.
“Available seat miles” represents the number of seats available for passengers multiplied by the number of
miles the seats are flown.
“Load factor” represents the percentage of aircraft seating capacity that is actually utilized (revenue passenger
miles divided by available seat miles).
24