JetBlue Airlines 2008 Annual Report Download - page 41
Download and view the complete annual report
Please find page 41 of the 2008 JetBlue Airlines annual report below. You can navigate through the pages in the report by either clicking on the pages listed below, or by using the keyword search tool below to find specific information within the annual report.-
 1
1 -
2
-
3
-
4
-
5
-
6
-
7
-
8
-
9
-
10
-
11
-
12
-
13
-
14
-
15
-
16
-
17
-
18
-
19
-
20
-
21
-
22
-
23
-
24
-
25
-
26
-
27
-
28
-
29
-
30
-
 31
31 -
 32
32 -
 33
33 -
 34
34 -
 35
35 -
 36
36 -
 37
37 -
 38
38 -
 39
39 -
 40
40 -
 41
41 -
 42
42 -
 43
43 -
 44
44 -
 45
45 -
 46
46 -
 47
47 -
 48
48 -
 49
49 -
 50
50 -
 51
51 -
52
-
53
-
54
-
55
-
56
-
57
-
58
-
59
-
60
-
61
-
62
-
63
-
64
-
65
-
66
-
67
-
68
-
69
-
70
-
71
-
72
-
73
-
74
-
75
-
76
-
77
-
78
-
79
-
80
-
81
-
82
-
83
-
84
-
85
-
86
-
87
-
88
-
89
-
90
-
91
-
92
-
93
-
94
-
95
-
96
-
97
-
98
-
99
-
100
-
101
-
102
-
103
-
104
-
105
-
106
-
107
-
108
-
109
-
110
 |
 |
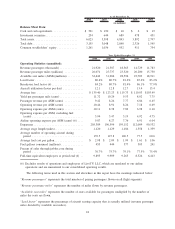
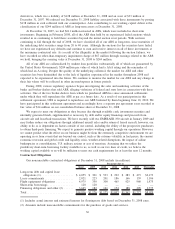
Depreciation and amortization increased 16%, or $25 million, primarily due to having an average of 78
owned and capital leased aircraft in 2007 compared to 67 in 2006.
Aircraft rent increased 20%, or $21 million, due to seven new EMBRAER 190 aircraft leases. Cost per
available seat mile increased 7% due to a higher percentage of our fleet being leased.
Sales and marketing expense increased 16%, or $17 million, primarily due to $11 million in higher credit
card fees resulting from increased passenger revenues and $5 million in commissions related to our
participation in GDSs. On a cost per available seat mile basis, sales and marketing expense increased 4%
primarily due to higher credit card fees and more GDS commissions. We book the majority of our reservations
through a combination of our website and our agents (76% and 16% in 2007, respectively).
Maintenance materials and repairs increased 21%, or $19 million, due to 21 more average operating
aircraft in 2007 compared to 2006 and a gradual aging of our fleet. Cost per available seat mile increased 9%,
primarily due to an increase in the average age of our fleet. Maintenance costs are expected to increase
significantly as our fleet ages.
Other operating expenses increased 19%, or $61 million, primarily due to higher variable costs associated
with 12% increased capacity and a 15% increase in the number of passengers served. $4 million of the
increase is related to LiveTV’s development of in-flight data connectivity and $5 million is attributable to
higher interrupted trip expenses. In addition, other operating expenses include $7 million and $12 million in
gains on sales of aircraft in 2007 and 2006, respectively. Cost per available seat mile increased 6% due
primarily to fewer gains on the sale of aircraft.
Other Income (Expense). Interest expense increased 31%, or $52 million, primarily due to increases of
$34 million in interest associated with the debt or capital lease financing for new aircraft deliveries,
$13 million of interest for the financing of previously unsecured property and $18 million of interest related to
our construction obligation for our new terminal at JFK. Interest expense was reduced by approximately
$7 million due to the scheduled pay downs of our long-term debt obligations and by an additional $6 million
related to retired debt for sold aircraft. The increase in capitalized interest was primarily attributable to the
higher interest expense incurred for our new terminal.
Interest income and other increased 96%, or $26 million, primarily due to a $17 million increase in
interest income due to higher average cash and investment balances and fuel hedge gains of $5 million in
2007 compared to fuel hedge losses of $5 million in 2006. We are unable to predict the amount of accounting
ineffectiveness related to our crude and heating oil derivative instruments each period, or the potential loss of
hedge accounting, which is determined on a derivative-by-derivative basis, due to the volatility in the market
for these commodities.
Our effective tax rate decreased to 55% in 2007 from 109% in 2006. Our effective tax rate differs from
the statutory income tax rate due to the nondeductibility of certain items for tax purposes and the relative size
of these items to our pre-tax income of $41 million and $9 million in 2007 and 2006, respectively.
32