JetBlue Airlines 2008 Annual Report Download - page 37
Download and view the complete annual report
Please find page 37 of the 2008 JetBlue Airlines annual report below. You can navigate through the pages in the report by either clicking on the pages listed below, or by using the keyword search tool below to find specific information within the annual report.-
 1
1 -
2
-
3
-
4
-
5
-
6
-
7
-
8
-
9
-
10
-
11
-
12
-
13
-
14
-
15
-
16
-
17
-
18
-
19
-
20
-
21
-
22
-
23
-
24
-
25
-
26
-
 27
27 -
 28
28 -
 29
29 -
 30
30 -
 31
31 -
 32
32 -
 33
33 -
 34
34 -
 35
35 -
 36
36 -
 37
37 -
 38
38 -
 39
39 -
 40
40 -
 41
41 -
 42
42 -
 43
43 -
 44
44 -
 45
45 -
 46
46 -
 47
47 -
48
-
49
-
50
-
51
-
52
-
53
-
54
-
55
-
56
-
57
-
58
-
59
-
60
-
61
-
62
-
63
-
64
-
65
-
66
-
67
-
68
-
69
-
70
-
71
-
72
-
73
-
74
-
75
-
76
-
77
-
78
-
79
-
80
-
81
-
82
-
83
-
84
-
85
-
86
-
87
-
88
-
89
-
90
-
91
-
92
-
93
-
94
-
95
-
96
-
97
-
98
-
99
-
100
-
101
-
102
-
103
-
104
-
105
-
106
-
107
-
108
-
109
-
110
 |
 |
actions which have, and will continue to allow them to compete more vigorously. In 2008, as a result of
continued high fuel prices and challenging economic conditions, at least eight domestic airlines ceased their
operations. We are unable to predict what the effect of further industry consolidation would be for us or for
the airline industry in general.
Our ability to be profitable in this competitive environment depends on, among other things, operating at
costs equal to or lower than those of our competitors, continuing to provide high quality customer service and
maintaining adequate liquidity levels. Although we have been able to raise capital and continue to grow, the
highly competitive nature of the airline industry and the impact of the current economic recession could
prevent us from attaining the passenger traffic or yields required to be profitable in new and existing markets.
The highest levels of traffic and revenue on our routes to and from Florida are generally realized from
October through April, and on our routes to and from the western United States in the summer. Many of our
areas of operations in the Northeast experience bad weather conditions in the winter, causing increased costs
associated with de-icing aircraft, cancelled flights and accommodating displaced passengers. Our Florida and
Caribbean routes experience bad weather conditions in the summer and fall due to thunderstorms and
hurricanes. As we enter new markets, we could be subject to additional seasonal variations along with
competitive responses to our entry by other airlines. Given our high proportion of fixed costs, this seasonality
may cause our results of operations to vary from quarter to quarter.
Outlook for 2009
Our focus in 2009 will continue to be on rational growth, rigorous cost control and revenue optimization
while managing risk in an uncertain and recessionary economic environment. We expect the slower growth
trend that we began to see in 2008 to continue through 2009. However, we will continue to reallocate capacity
in order to take advantage of market opportunities, including potential further reductions in transcontinental
flights and an increased Caribbean presence. In addition, we are continuously looking to expand our other
revenue opportunities.
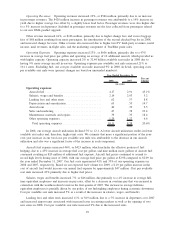
We expect our full-year operating capacity for 2009 to decrease approximately 2% to 0% over 2008 with
the addition of three new Airbus A320 aircraft and eight new EMBRAER 190 aircraft to our operating fleet,
offset by the planned lease return of one of our Airbus A320 aircraft during the year and the sale of two of
our EMBRAER 190 aircraft in January 2009. Assuming fuel prices of $1.99 per gallon, net of effective
hedges, our cost per available seat mile for 2009 is expected to decrease by 5% to 7% over 2008. Our
operating margin is expected to be between 12% and 14% and our pre-tax margin is expected to be between
6% and 8% for the full year. We expect our corrected first quarter 2009 weighted shares outstanding to be
243.9 (basic and diluted) with full year 2009 estimates to be 244.6 (basic) and 275.6 (diluted).
Results of Operations
The U.S. domestic airline environment was extremely challenging throughout 2008 primarily due to high
aircraft fuel prices and vigorous price competition, along with a softening demand environment attributable to
deteriorating economic conditions. However, due to the optimization of our own fare mix, average fares for
the year increased 13% over 2007 to $139, while load factor declined 0.3 points to 80.4% from the full
year 2007.
Our on-time performance, defined by the DOT as arrivals within 14 minutes of schedule, was 73.2% in
2008 compared to 70.2% in 2007. While we saw some improvement in our on-time performance on a year-
over-year, it continued to be affected by the fact that a significant percentage of our flights operate out of
three of the most congested and delay-prone airports in the U.S., as reflected by our 98.4% and 98.0%
completion factors in 2008 and 2007, respectively.
Year 2008 Compared to Year 2007
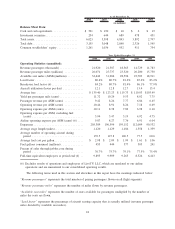
We reported a net loss of $76 million in 2008 compared to net income of $18 million in 2007. In 2008,
we had operating income of $109 million, a decrease of $60 million over 2007, and our operating margin was
3.2%, down 2.8 points from 2007. Diluted loss per share was $0.34 for 2008 compared to diluted earnings per
share of $0.10 for 2007.
28