JetBlue Airlines 2008 Annual Report Download - page 36
Download and view the complete annual report
Please find page 36 of the 2008 JetBlue Airlines annual report below. You can navigate through the pages in the report by either clicking on the pages listed below, or by using the keyword search tool below to find specific information within the annual report.-
 1
1 -
2
-
3
-
4
-
5
-
6
-
7
-
8
-
9
-
10
-
11
-
12
-
13
-
14
-
15
-
16
-
17
-
18
-
19
-
20
-
21
-
22
-
23
-
24
-
25
-
 26
26 -
 27
27 -
 28
28 -
 29
29 -
 30
30 -
 31
31 -
 32
32 -
 33
33 -
 34
34 -
 35
35 -
 36
36 -
 37
37 -
 38
38 -
 39
39 -
 40
40 -
 41
41 -
 42
42 -
 43
43 -
 44
44 -
 45
45 -
 46
46 -
47
-
48
-
49
-
50
-
51
-
52
-
53
-
54
-
55
-
56
-
57
-
58
-
59
-
60
-
61
-
62
-
63
-
64
-
65
-
66
-
67
-
68
-
69
-
70
-
71
-
72
-
73
-
74
-
75
-
76
-
77
-
78
-
79
-
80
-
81
-
82
-
83
-
84
-
85
-
86
-
87
-
88
-
89
-
90
-
91
-
92
-
93
-
94
-
95
-
96
-
97
-
98
-
99
-
100
-
101
-
102
-
103
-
104
-
105
-
106
-
107
-
108
-
109
-
110
 |
 |
operating conditions continued to worsen in 2008. These challenging operating conditions were especially
difficult during the summer months of 2008 when ground delay programs were in effect more days than not.
We continue to work actively with the Port Authority of New York and New Jersey, or PANYNJ, and the
Federal Aviation Administration, or FAA, to find solutions to ease this congestion.
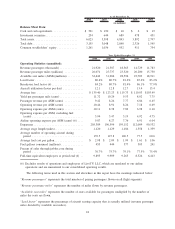
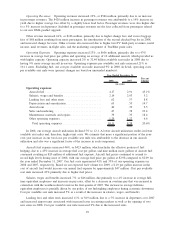
We derive our revenue primarily from transporting passengers on our aircraft. Passenger revenue
accounted for 90% of our total operating revenues for the year ended December 31, 2008. Revenues generated
from international routes, excluding Puerto Rico, accounted for 10% of our total passenger revenues in 2008.
Revenue is recognized either when transportation is provided or after the ticket or customer credit expires. We
measure capacity in terms of available seat miles, which represents the number of seats available for
passengers multiplied by the number of miles the seats are flown. Yield, or the average amount one passenger
pays to fly one mile, is calculated by dividing passenger revenue by revenue passenger miles.
We strive to increase passenger revenue primarily by increasing our yield per flight, which produces
higher revenue per available seat mile, or RASM. Our objective is to optimize our fare mix to increase our
overall average fare and, in certain markets, utilize our network to maximize connecting opportunities while
continuing to provide our customers with competitive fares. When we enter a new market, our fares are
designed to stimulate demand, particularly from fare-conscious leisure and business travelers who might
otherwise have used alternate forms of transportation or would not have traveled at all. In addition to our
regular fare structure, we frequently offer sale fares with shorter advance purchase requirements in most of the
markets we serve and match the sale fares offered by other airlines. In 2008, we introduced our Even More
Legroom, or EML, seats, an optional upgrade to our product that offers seats with additional seat pitch for a
modest additional fee, which has also allowed us to increase passenger revenues.
Other revenue consists primarily of fees charged to customers in accordance with our published policies
relating to reservation changes and baggage limitations, the marketing component of TrueBlue point sales,
concession revenues and revenues earned by our subsidiary, LiveTV, LLC, for the sale of, and on-going
services provided for, in-flight entertainment systems sold to other airlines.
We maintain one of the lowest cost structures in the industry due to the young average age of our fleet, a
productive workforce, and cost discipline. In 2009, we plan to continue our focus on cost control while
improving the JetBlue Experience for our customers. The largest components of our operating expenses are
aircraft fuel and salaries, wages and benefits provided to our employees. Unlike most airlines, we have a
non-union workforce, which we believe provides us with more flexibility and allows us to be more productive,
although we are subject to ongoing attempts at unionization. The price and availability of aircraft fuel, which
is our single largest operating expense, are extremely volatile due to global economic and geopolitical factors
that we can neither control nor accurately predict. Sales and marketing expenses include advertising and fees
paid to credit card companies. Our distribution costs tend to be lower than those of most other airlines on a
per unit basis because the majority of our customers book directly through our website or our agents.
Maintenance materials and repairs are expensed when incurred unless covered by a third party services
contract. Because the average age of our aircraft is 3.6 years, all of our aircraft require less maintenance now
than they will in the future. Our maintenance costs will increase significantly, both on an absolute basis and as
a percentage of our unit costs, as our fleet ages. Other operating expenses consist of purchased services
(including expenses related to fueling, ground handling, skycap, security and janitorial services), insurance,
personnel expenses, cost of goods sold to other airlines by LiveTV, professional fees, passenger refreshments,
supplies, bad debts, communication costs, gains on aircraft sales and taxes other than payroll taxes, including
fuel taxes.
The airline industry is one of the most heavily taxed in the U.S., with taxes and fees accounting for
approximately 14% of the total fare charged to a customer. Airlines are obligated to fund all of these taxes
and fees regardless of their ability to pass these charges on to the customer. Additionally, if the TSA changes
the way the Aviation Security Infrastructure Fee is assessed, our security costs may be higher.
The airline industry has been intensely competitive in recent years, due in part to persistently high fuel
prices and the adverse financial condition of many of the domestic airlines. In 2005 US Airways and America
West merged, and each of Delta Air Lines and Northwest Airlines filed for bankruptcy protection. Both Delta
and Northwest emerged from bankruptcy in 2007 with lower costs and, in 2008, they merged their operations,
27