JetBlue Airlines 2008 Annual Report Download - page 42
Download and view the complete annual report
Please find page 42 of the 2008 JetBlue Airlines annual report below. You can navigate through the pages in the report by either clicking on the pages listed below, or by using the keyword search tool below to find specific information within the annual report.-
 1
1 -
2
-
3
-
4
-
5
-
6
-
7
-
8
-
9
-
10
-
11
-
12
-
13
-
14
-
15
-
16
-
17
-
18
-
19
-
20
-
21
-
22
-
23
-
24
-
25
-
26
-
27
-
28
-
29
-
30
-
31
-
 32
32 -
 33
33 -
 34
34 -
 35
35 -
 36
36 -
 37
37 -
 38
38 -
 39
39 -
 40
40 -
 41
41 -
 42
42 -
 43
43 -
 44
44 -
 45
45 -
 46
46 -
 47
47 -
 48
48 -
 49
49 -
 50
50 -
 51
51 -
 52
52 -
53
-
54
-
55
-
56
-
57
-
58
-
59
-
60
-
61
-
62
-
63
-
64
-
65
-
66
-
67
-
68
-
69
-
70
-
71
-
72
-
73
-
74
-
75
-
76
-
77
-
78
-
79
-
80
-
81
-
82
-
83
-
84
-
85
-
86
-
87
-
88
-
89
-
90
-
91
-
92
-
93
-
94
-
95
-
96
-
97
-
98
-
99
-
100
-
101
-
102
-
103
-
104
-
105
-
106
-
107
-
108
-
109
-
110
 |
 |

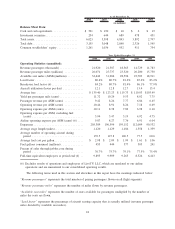
Quarterly Results of Operations
The following table sets forth selected financial data and operating statistics for the four quarters ended
December 31, 2008. The information for each of these quarters is unaudited and has been prepared on the
same basis as the audited consolidated financial statements appearing elsewhere in this Form 10-K.
March 31,
2008
June 30,
2008
September 30,
2008
December 31,
2008
Three Months Ended
Statements of Operations Data (dollars in millions)
Operating revenues . . . ............................ $ 816 $ 859 $ 902 $ 811
Operating expenses:
Aircraft fuel . ................................. 308 370 394 280
Salaries, wages and benefits....................... 178 168 173 175
Landing fees and other rents ...................... 51 49 52 48
Depreciation and amortization (1) . ................. 45 46 54 60
Aircraft rent . ................................. 32 32 33 32
Sales and marketing ............................ 39 42 38 33
Maintenance materials and repairs . ................. 33 32 32 30
Other operating expenses (2) ...................... 113 99 104 104
Total operating expenses . . ....................... 799 838 880 762
Operating income (loss) ........................... 17 21 22 49
Other income (expense) (3) . . ....................... (30) (31) (26) (98)
Income (loss) before income taxes . . . ................. (13) (10) (4) (49)
Income tax expense (benefit) . ....................... (5) (3) — 8
Net income (loss) ................................ $ (8) $ (7) $ (4) $ (57)
Operating margin ................................ 2.2% 2.4% 2.4% 6.1%
Pre-tax margin . ................................. (1.5)% (1.2)% (0.5)% (6.0)%
Operating Statistics:
Revenue passengers (thousands)...................... 5,518 5,637 5,657 5,108
Revenue passenger miles (millions) . . ................. 6,563 6,756 6,848 5,904
Available seat miles ASM (millions) . ................. 8,395 8,383 8,154 7,510
Load factor . . . ................................. 78.2% 80.6% 84.0% 78.6%
Breakeven load factor (4) . . . ....................... 82.2% 84.1% 89.7% 80.6%
Aircraft utilization (hours per day) . . . ................. 12.9 12.6 11.7 11.2
Average fare. . . ................................. $135.64 $138.13 $142.55 $141.37
Yield per passenger mile (cents) ..................... 11.40 11.53 11.78 12.23
Passenger revenue per ASM (cents) . . ................. 8.92 9.29 9.89 9.62
Operating revenue per ASM (cents) . . ................. 9.72 10.24 11.07 10.80
Operating expense per ASM (cents) . . ................. 9.51 9.99 10.80 10.14
Operating expense per ASM, excluding fuel (cents) . ...... 5.84 5.59 5.96 6.42
Airline operating expense per ASM (cents) (4) ........... 9.37 9.69 10.56 9.86
Departures ..................................... 52,265 52,236 51,125 49,763
Average stage length (miles) . ....................... 1,131 1,138 1,132 1,075
Average number of operating aircraft during period. . ...... 136.3 139.6 142.2 139.9
Average fuel cost per gallon . ....................... $ 2.65 $ 3.17 $ 3.42 $ 2.67
Fuel gallons consumed (millions)..................... 117 116 115 105
Percent of sales through jetblue.com during period . . ...... 76.7% 77.2% 76.9% 75.7%
Full-time equivalent employees at period end (4) . . . ...... 10,165 9,856 9,398 9,895
(1) During the third quarter, we wrote off $8 million related to our temporary terminal facility at JFK.
33