JetBlue Airlines 2008 Annual Report Download - page 32
Download and view the complete annual report
Please find page 32 of the 2008 JetBlue Airlines annual report below. You can navigate through the pages in the report by either clicking on the pages listed below, or by using the keyword search tool below to find specific information within the annual report.-
 1
1 -
2
-
3
-
4
-
5
-
6
-
7
-
8
-
9
-
10
-
11
-
12
-
13
-
14
-
15
-
16
-
17
-
18
-
19
-
20
-
21
-
 22
22 -
 23
23 -
 24
24 -
 25
25 -
 26
26 -
 27
27 -
 28
28 -
 29
29 -
 30
30 -
 31
31 -
 32
32 -
 33
33 -
 34
34 -
 35
35 -
 36
36 -
 37
37 -
 38
38 -
 39
39 -
 40
40 -
 41
41 -
 42
42 -
43
-
44
-
45
-
46
-
47
-
48
-
49
-
50
-
51
-
52
-
53
-
54
-
55
-
56
-
57
-
58
-
59
-
60
-
61
-
62
-
63
-
64
-
65
-
66
-
67
-
68
-
69
-
70
-
71
-
72
-
73
-
74
-
75
-
76
-
77
-
78
-
79
-
80
-
81
-
82
-
83
-
84
-
85
-
86
-
87
-
88
-
89
-
90
-
91
-
92
-
93
-
94
-
95
-
96
-
97
-
98
-
99
-
100
-
101
-
102
-
103
-
104
-
105
-
106
-
107
-
108
-
109
-
110
 |
 |

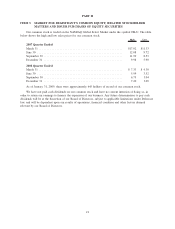
ITEM 6. SELECTED FINANCIAL DATA
The following financial information for the five years ended December 31, 2008 has been derived from
our consolidated financial statements. This information should be read in conjunction with the consolidated
financial statements and related notes thereto included elsewhere in this report.
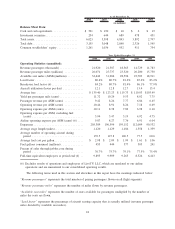
2008 2007 2006 2005 2004
Year Ended December 31,
(in millions, except per share data)
Statements of Operations Data:
Operating revenues ............................ $3,388 $2,842 $ 2,363 $ 1,701 $1,265
Operating expenses:
Aircraft fuel ............................... 1,352 929 752 488 255
Salaries, wages and benefits (1) ................. 694 648 553 428 337
Landing fees and other rents ................... 199 180 158 112 92
Depreciation and amortization (2) ............... 205 176 151 115 77
Aircraft rent ............................... 129 124 103 74 70
Sales and marketing ......................... 151 121 104 81 63
Maintenance materials and repairs ............... 127 106 87 64 45
Other operating expenses (3) ................... 422 389 328 291 215
Total operating expenses .................... 3,279 2,673 2,236 1,653 1,154
Operating income ............................. 109 169 127 48 111
Other income (expense) (4) ...................... (185) (128) (118) (72) (36)
Income (loss) before income taxes ................ (76) 41 9 (24) 75
Income tax expense (benefit)..................... — 23 10 (4) 29
Net income (loss) ............................. $ (76) $ 18 $ (1) $ (20) $ 46
Earnings (loss) per common share:
Basic .................................... $(0.34) $ 0.10 $ — $ (0.13) $ 0.30
Diluted ................................... $(0.34) $ 0.10 $ — $ (0.13) $ 0.28
Other Financial Data:
Operating margin ............................. 3.2% 6.0% 5.4% 2.8% 8.8%
Pre-tax margin ............................... (2.2)% 1.4% 0.4% (1.4)% 5.9%
Ratio of earnings to fixed charges (5) .............. — — — 1.6x
Net cash provided by (used in) operating activities .... $ (17) $ 358 $ 274 $ 170 $ 199
Net cash used in investing activities ............... (247) (734) (1,307) (1,276) (720)
Net cash provided by financing activities............ 635 556 1,037 1,093 437
(1) In 2005, we recorded $7 million in non-cash stock-based compensation expense related to the acceleration
of certain employee stock options.
(2) In 2008, we wrote-off $8 million related to our temporary terminal facility at JFK.
(3) In 2008, 2007, and 2006, we sold nine, three, and five Airbus A320 aircraft, respectively, which resulted
in gains of $23 million, $7 million, and $12 million, respectively. In 2005, we wrote-off $6 million in
development costs relating to a maintenance and inventory tracking system that was not implemented
(4) In 2008, we recorded $13 million in additional interest expense related to the early conversion of a portion
of our 5.5% convertible debentures due 2038 and $18 million in interest income related to the gain on
extinguishment of debt. In December 2008, we recorded an other-than-temporary impairment of
$53 million related to the write-down of the value our auction rate securities.
(5) Earnings were inadequate to cover fixed charges by $122 million, $1 million, $17 million and $39 million
for the years ended December 31, 2008, 2007, 2006, and 2005, respectively.
23