JetBlue Airlines 2008 Annual Report Download - page 39
Download and view the complete annual report
Please find page 39 of the 2008 JetBlue Airlines annual report below. You can navigate through the pages in the report by either clicking on the pages listed below, or by using the keyword search tool below to find specific information within the annual report.-
 1
1 -
2
-
3
-
4
-
5
-
6
-
7
-
8
-
9
-
10
-
11
-
12
-
13
-
14
-
15
-
16
-
17
-
18
-
19
-
20
-
21
-
22
-
23
-
24
-
25
-
26
-
27
-
28
-
 29
29 -
 30
30 -
 31
31 -
 32
32 -
 33
33 -
 34
34 -
 35
35 -
 36
36 -
 37
37 -
 38
38 -
 39
39 -
 40
40 -
 41
41 -
 42
42 -
 43
43 -
 44
44 -
 45
45 -
 46
46 -
 47
47 -
 48
48 -
 49
49 -
50
-
51
-
52
-
53
-
54
-
55
-
56
-
57
-
58
-
59
-
60
-
61
-
62
-
63
-
64
-
65
-
66
-
67
-
68
-
69
-
70
-
71
-
72
-
73
-
74
-
75
-
76
-
77
-
78
-
79
-
80
-
81
-
82
-
83
-
84
-
85
-
86
-
87
-
88
-
89
-
90
-
91
-
92
-
93
-
94
-
95
-
96
-
97
-
98
-
99
-
100
-
101
-
102
-
103
-
104
-
105
-
106
-
107
-
108
-
109
-
110
 |
 |
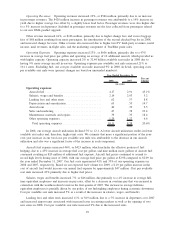
Depreciation and amortization increased 17%, or $29 million, primarily due to having an average of 85
owned and capital leased aircraft in 2008 compared to 78 in 2007 and an $8 million asset write-off related to
our temporary terminal facility at JFK in 2008, as well as $5 million in depreciation related to our new
terminal at JFK in 2008. Cost per available seat mile was 15% higher due to the asset write-off.
Aircraft rent increased 4%, or $5 million, due to operating an average of five more aircraft under
operating leases in 2008 compared to 2007. Cost per available seat mile increased 3% due to a higher
percentage of our fleet being leased.
Sales and marketing expense increased 26%, or $30 million, primarily due to $16 million in higher credit
card fees resulting from increased passenger revenues and $5 million in commissions related to our
participation in GDSs, as well as $10 million in higher advertising costs in 2008, which included the launch of
our “Happy Jetting” campaign. On a cost per available seat mile basis, sales and marketing expense increased
23%, primarily due to higher advertising costs and higher credit card fees associated with our increase in
average fares. We book the majority of our reservations through a combination of our website and our agents
(77% and 10% in 2008, respectively).
Maintenance materials and repairs increased 19%, or $21 million, due to 12 more average operating
aircraft in 2008 compared to 2007 and a gradual aging of our fleet. Cost per available seat mile increased
18%, primarily due to an increase in the average age of our fleet. Maintenance expense is expected to increase
significantly as our fleet ages.
Other operating expenses increased 8%, or $33 million, primarily due to taxes associated with the
increase in fuel price, more LiveTV third-party customers, higher variable costs associated with a 2% increase
in capacity and a 3% increase in the number of passengers served. Other operating expenses include the
impact of $23 million and $7 million in gains on sales of aircraft in 2008 and 2007, respectively. Other
operating expenses were further offset in 2008 by $7 million for certain tax incentives. Cost per available seat
mile increased 7% due primarily to additional LiveTV third-party customer installations and taxes associated
with the increase in fuel price.
Other Income (Expense). Interest expense increased 3%, or $7 million, primarily due to the impact of
partial conversion of our 5.5% convertible debentures due 2038 and the associated $11 million of accelerated
payments from the escrow accounts for these securities, $2 million in issuance cost write-offs and increases of
$33 million in interest associated with the debt financing for new aircraft deliveries and other non-aircraft
related debt. Interest expense was reduced by approximately $43 million due to lower interest rates and the
scheduled pay downs of our long-term debt obligations and an additional $8 million related to retired debt for
sold aircraft. Interest expense also included an increased accretion in interest related to the construction
obligation for our new terminal at JFK, of which $12 million was capitalized. This increase in capitalized
interest was offset by lower balances on our pre-delivery deposit facility and lower interest rates.
Interest income and other decreased 102%, or $55 million, primarily due to a $53 million net impairment
charge for ARS and a $20 million decrease in interest income due to lower rates of return in 2008, offset
partially by $18 million in gains on the extinguishment of debt.
Our effective tax rate was 0% in 2008 compared to 55% in 2007, mainly due to the establishment of a
valuation allowance of $21 million related to our $67 million ARS impairment. Our effective tax rate differs
from the statutory income tax rate due to the non deductibility of certain items for tax purposes and the
relative size of these items to our pre-tax loss of $76 million in 2008 and pre-tax income $41 million in 2007.
Year 2007 Compared to Year 2006
We had net income of $18 million in 2007 compared to a net loss of $1 million in 2006. In 2007, we had
operating income of $169 million, an increase of $42 million over 2006, and our operating margin was 6.0%,
up 0.6 points from 2006. Diluted earnings per share were $0.10 for 2007 and $0.00 for 2006.
Operating Revenues. Operating revenues increased 20%, or $479 million, primarily due to an increase
in passenger revenues. The $413 million increase in passenger revenues was attributable to a 7.4% increase in
30