JCPenney 2002 Annual Report Download - page 44
Download and view the complete annual report
Please find page 44 of the 2002 JCPenney annual report below. You can navigate through the pages in the report by either clicking on the pages listed below, or by using the keyword search tool below to find specific information within the annual report.-
 1
1 -
2
-
3
-
4
-
5
-
6
-
7
-
8
-
9
-
10
-
11
-
12
-
13
-
14
-
15
-
16
-
17
-
18
-
19
-
20
-
21
-
22
-
23
-
24
-
25
-
26
-
27
-
28
-
29
-
30
-
31
-
32
-
33
-
 34
34 -
 35
35 -
 36
36 -
 37
37 -
 38
38 -
 39
39 -
 40
40 -
 41
41 -
 42
42 -
 43
43 -
 44
44 -
 45
45 -
 46
46 -
 47
47 -
 48
48
 |
 |

2002 annual report J. C. Penney Company, Inc. 41
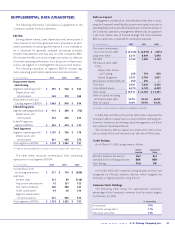
SUPPLEMENTAL DATA (UNAUDITED)
The following information is provided as a supplement to the
Company’s audited financial statements.
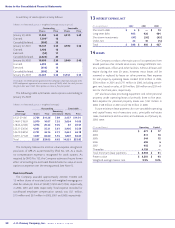
EBITDA
Earnings before interest, taxes, depreciation and amortization is
a key measure of cash flow generated and is provided as an alter-
native assessment of operating performance. It is not intended to
be a substitute for generally accepted accounting principles
(GAAP) measurements and may vary for other companies. EBIT-
DA includes the effects of certain charges and credits not reflective
of normal operating performance. For a discussion of these trans-
actions, see pages 8-11 in Management’s Discussion and Analysis.
The following calculation of segment EBITDA includes seg-
ment operating profit before depreciation and amortization.
($ in millions) 2002 2001 2000
Department Stores
and Catalog
Segment operating profit(1) $ 695 $ 548 $ 254
Depreciation and
amortization 368 370 360
Department Stores and
Catalog segment EBITDA $ 1,063 $ 918 $ 614
Eckerd Drugstores
Segment operating profit/(loss)(1) $ 412 $ 208 $ (76)
Depreciation and
amortization 253 226 213
Eckerd Drugstores
segment EBITDA $ 665 $ 434 $ 137
Total Segments
Segment operating profit(1) $ 1,107 $ 756 $ 178
Depreciation and
amortization 621 596 573
Total segments EBITDA $ 1,728 $ 1,352 $ 751
(1) Segment operating profit/(loss) excludes net interest expense and income taxes.
The table below reconciles income/(loss) from continuing
operations to total segment EBITDA:
($ in millions) 2002 2001 2000
Income/(loss) from
continuing operations $ 371 $ 114 $ (568)
Add back:
Income taxes 213 89 (318)
Acquisition amortization 42 121 122
Net interest expense 388 386 427
Other unallocated 93 46 515
Segment depreciation
and amortization 621 596 573
Total segments EBITDA $ 1,728 $ 1,352 $ 751
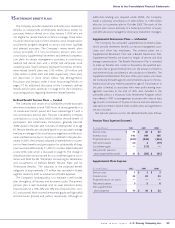
Debt-to-Capital
Management considers all on- and off-balance sheet debt in evalu-
ating the Company’s overall liquidity position and capital structure. As
operating leases and securitized receivables are a fundamental part of
the Company’s operations, management believes that this approach
is the most realistic view of financial leverage. The more traditional
debt-to-capital ratio is presented for comparison purposes.
($ in millions) 2002 2001 2000
Short-term investments,
net of short-term debt $ (2,455) $ (2,819) $ (935)
Long-term debt(1) 5,215 6,099 5,698
Net debt 2,760 3,280 4,763
Off-balance sheet debt:
PVOL:
Department Stores
and Catalog 659 794 838
Eckerd Drugstores 2,922 2,764 2,631
Securitization of receivables, net 200 200 —
Tot al debt 6,541 7,038 8,232
Consolidated equity 6,370 6,129 6,259
Total capital $ 12,911 $ 13,167 $ 14,491
Debt-to-capital, including
off-balance sheet debt 50.7% 53.5% 56.8%
Debt-to-capital 30.2% 34.9% 43.2%
(1) Includes current maturities, capital lease obligations and other.
In 2002, free cash flow of more than $500 million improved the
Company’s debt-to-capital ratio as a result of better operating per-
formance, inventory and working capital management, and lower
than planned capital expenditures.
The Company’s debt-to-capital ratio improved in 2001 prima-
rily as a result of the cash received from the sale of DMS assets.
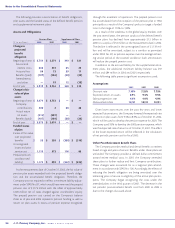
Credit Ratings
As of March 21, 2003, ratings were as follows:
Senior Long-term
Implied Debt
Moody’s Investors Service, Inc. Ba2 Ba3
Standard & Poor’s Ratings Services BBB- BBB-
Fitch Ratings N/A BB
In October 2002, the Company’s strong liquidity position was
recognized by Moody’s Investors Service, which assigned the
Company its highest liquidity rating (SGL-1).
Common Stock Holdings
The following table shows the approximate ownership
percentage of the Company’s common stock by major category
as of January 25, 2003:
% Ownership
Institutional 70%
Company savings plans 17%
Individual and other 13%