JCPenney 2002 Annual Report Download - page 14
Download and view the complete annual report
Please find page 14 of the 2002 JCPenney annual report below. You can navigate through the pages in the report by either clicking on the pages listed below, or by using the keyword search tool below to find specific information within the annual report.
2002 annual report J. C. Penney Company, Inc. 11
Management’s Discussion and Analysis of Financial Condition and Results of Operations
LIFO gross margin increased 70 basis points as a percent of
sales, reflecting a better product mix, higher generic dispensing
rates in pharmacy and better control over shrinkage, despite
implementation of more competitive pricing. In addition, gross
margin for 2000 included inventory related charges of $104 mil-
lion, which represented incremental markdowns on discontinued
merchandise in order to reposition the merchandise mix and to
liquidate merchandise under the store closing plan. Gross margin
included LIFO charges of $47 million in 2001 and $55 million in
2000. LIFO charges in both years primarily reflect price inflation on
prescription drugs.
SG&A expenses improved by 140 basis points as a percentage
of sales, resulting primarily from an emphasis on cost manage-
ment and the leverage of increased sales. 2001 SG&A expenses
were lower in the following areas: information technology from
bringing the function back in-house, net advertising and pension
costs because Eckerd ceased participation in the JCPenney pen-
sion plan. Included in SG&A for 2001 was an $11 million gain for
pension curtailment and $5 million in transition costs related to
the in-sourcing of information technology. In 2000, SG&A includ-
ed $12 million of store closing activity costs.
Other Unallocated
Other unallocated of $93 million, $46 million and $515 million
for 2002, 2001 and 2000, respectively, consists of real estate activi-
ties, investment transactions, asset impairments, unit closing
costs, which include remaining lease obligations, and other items
that are related to corporate initiatives or activities, which are not
allocated to an operating segment but are included in total
Company operating results.
Certain charges or credits recorded in other unallocated, such as
asset impairments, unit closings, gains on sale of real estate part-
nership interests, and centralized merchandising process (ACT)
costs, are not reflective of normal ongoing operations. These net
charges were $105 million, $42 million and $543 million in 2002,
2001 and 2000, respectively. Net charges are summarized below
and discussed in more detail in Note 16.
In 2002, charges of $105 million related primarily to asset
impairments and lease obligations for certain department stores
in the United States and Mexico and certain catalog and other
facilities. Impairments are the result of the Company’s on-going
process to evaluate the productivity of its asset base, as described
under “Valuation of Long-Lived and Intangible Assets, including
Goodwill” on page 5.
Net charges of $42 million in 2001 consisted of $63 million of
asset impairments and unit closing costs for catalog store closings,
underperforming department stores, outside stockrooms, third
party fulfillment operations and adjustments made to prior peri-
od restructuring reserves, $36 million of ACT costs, and $57 mil-
lion of real estate gains on the sale of two partnership interests.
In 2000, charges of $543 million were comprised of $488 million
related to asset impairments, PVOL and other unit closing costs, and
$55 million of ACT costs. The net charge of $488 million for asset
impairments, PVOL and other unit closing costs consisted of $206 mil-
lion of department store closings; $111 million of drugstore closings;
$91 million of asset impairments for department stores; drugstores
and a non-strategic business investment; $84 million related to con-
tract cancellations; $35 million of headcount reductions; a $13 million
gain on the sale of assets; and a $26 million net credit for adjustments
related to prior period restructuring reserves and other.
Net Interest Expense
Net interest expense totaled $388 million, $386 million and
$427 million in 2002, 2001 and 2000, respectively. The slight
increase in 2002 is related to the amortization of fees on the new
credit facility and lower returns on short-term investments, par-
tially offset by lower expense from reduced borrowing levels.
Interest expense declined in 2001 as a result of improved cash bal-
ances and the declines in average debt outstanding. Long-term
debt maturities totaled approximately $920 million and $250 mil-
lion in 2002 and 2001, respectively.
Income Taxes
The overall effective tax rates were 36.5%, 43.7% and (35.9%) for
2002, 2001 and 2000, respectively. The lower rate in 2002 is due to
recent changes in tax law related to the deductibility of dividends
paid to the Company’s savings plan and effects of adopting SFAS
No. 142 (amortization of goodwill) discussed in Note 1 on pages
25-26. In 2001, the tax rate increased due to a higher percentage
of non-deductible permanent book/tax differences, principally
goodwill, relative to income than in prior years. In 2000, due to the
loss from continuing operations, certain tax planning benefits
were not utilized, resulting in a lower tax benefit. Losses that
resulted from these benefits have been carried forward to future
years. Based on the short time periods for carryforwards in certain
states, valuation allowances of $97 million and $85 million in 2002
and 2001, respectively, have been established for those benefits
not expected to be realized.
FINANCIAL CONDITION
Liquidity and Capital Resources
To support the Company’s previously stated turnaround ini-
tiatives, in 2001 management developed a long-term financing
strategy to strengthen the Company’s liquidity position. The pri-
mary goal of the Company’s strategy is to ensure financial flexi-
bility and access to capital over the turnaround timeframe. This
will allow adequate time to restore the profitability of the
Company’s businesses to competitive levels and to increase cap-
ital spending levels to fund both future growth at Eckerd and to
update the infrastructure of Department Stores and Catalog.
The Company’s financial condition and liquidity continued to
strengthen during 2002 and now provides increased resources to
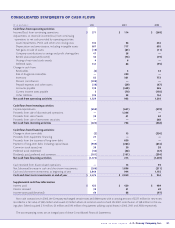
accomplish its business objectives. Cash flow from operating activ-
ities was $1.3 billion in 2002 compared with $0.9 billion in 2001 and
$1.5 billion in 2000. Free cash flow, defined as cash flow from oper-
ating activities less dividends and capital expenditures net of pro-
ceeds from the sale of assets, exceeded $500 million for the year
compared to approximately $200 million of free cash flow gener-
ated in 2001. Free cash flow for 2002 exceeded plan primarily as a


