JCPenney 2002 Annual Report Download - page 17
Download and view the complete annual report
Please find page 17 of the 2002 JCPenney annual report below. You can navigate through the pages in the report by either clicking on the pages listed below, or by using the keyword search tool below to find specific information within the annual report.-
 1
1 -
2
-
3
-
4
-
5
-
6
-
 7
7 -
 8
8 -
 9
9 -
 10
10 -
 11
11 -
 12
12 -
 13
13 -
 14
14 -
 15
15 -
 16
16 -
 17
17 -
 18
18 -
 19
19 -
 20
20 -
 21
21 -
 22
22 -
 23
23 -
 24
24 -
 25
25 -
 26
26 -
 27
27 -
28
-
29
-
30
-
31
-
32
-
33
-
34
-
35
-
36
-
37
-
38
-
39
-
40
-
41
-
42
-
43
-
44
-
45
-
46
-
47
-
48
 |
 |

J. C. Penney Company, Inc. 2002 annual report14
Management’s Discussion and Analysis of Financial Condition and Results of Operations
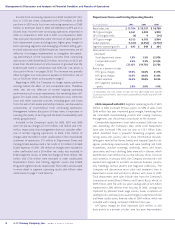
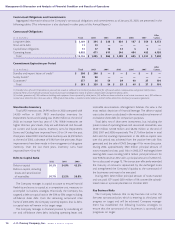
Merchandise Inventory
Total LIFO inventory was $4,945 million in 2002 compared with
$4,930 million in 2001. FIFO merchandise inventory for
Department Stores and Catalog was $3,030 million at the end of
2002, an increase from last year of 1.7%. While inventories are
higher than last year’s levels, they are well-balanced and focused
on current and future seasons. Inventory turns for Department
Stores and Catalog have improved from 3.0 to 3.4 over the past
three years. Eckerd FIFO merchandise inventory was $2,318 million
at the end of 2002, a decrease of 0.5% from the prior year. Major
improvements have been made in the management of drugstore
inventory. Over the last three years, inventory turns have
improved from 4.0 to 4.8.
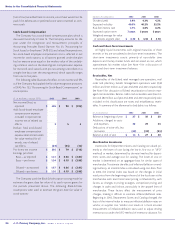
Debt-to-Capital Ratio
2002 2001 2000
Debt-to-capital 30.2% 34.9% 43.2%
Debt-to-capital, including
leases and securitization
of receivables 50.7% 53.5% 56.8%
The Company manages its capital structure to ensure financial
flexibility and access to capital, at a competitive cost, necessary to
accomplish its business strategies. Historically, the Company has
targeted a debt-to-capital ratio in the 50% to 55% range, including
off-balance sheet debt. Over the remaining turnaround time
frame of 2003-2005, the Company currently expects that its debt-
to-capital ratio will remain in this target range.
The Company manages its financial position by considering all
on- and off-balance sheet debt, including operating leases and
receivable securitizations. Management believes this view is the
most realistic depiction of financial leverage. The debt-to-capital
ratio is also shown as calculated in the more traditional manner of
on-balance sheet debt for comparison purposes.
Total debt, net of short-term investments, but including the
present value of operating leases and securitized receivables, was
$6,541 million, $7,038 million and $8,232 million at the end of
2002, 2001 and 2000, respectively. The $1.7 billion decline in total
debt and the resulting improvement in the debt-to-capital ratio
over this period was achieved from the positive free cash flow
generated and the sale of DMS. See page 41 for more discussion.
During 2002, approximately $920 million principal amount of
notes matured and was paid. Also in 2002, JCP exchanged three
existing debt issues totaling $227.2 million principal amount for
new 9.0% Notes Due 2012 with a principal amount of $230.2 mil-
lion as discussed on page 12. The transaction effectively extended
the maturity on amounts represented by the exchanged notes
and strengthened the Company’s liquidity as the turnaround of
the businesses continues to be executed.
During 2001, $250 million principal amount of notes matured
and was paid. JCP issued $650 million of 5% convertible subordi-
nated notes in a private placement in October 2001.
Key Business Risks
The Company believes that its key business risk is that the
five-year turnaround plan, which is entering its third year, will
progress on target and will be achieved. Company manage-
ment has established the following business strategies to
ensure that the turnaround of its businesses is successful and
progresses on target:
Contractual Obligations and Commitments
Aggregated information about the Company’s contractual obligations and commitments as of January 25, 2003, are presented in the
following tables. (This information is also disclosed in other parts of this Annual Report.)
Contractual Obligations
After
($ in millions) Total 2003 2004 2005 2006 2007 5 years
Long-term debt $ 5,169 $ 394 $ 238 $ 624 $ 187 $ 554 $ 3,172
Short-term debt 13 13—————
Capital lease obligations 51 17 16 12 4 2 —
Operating leases 6,903 671 611 544 494 455 4,128
Tot al $ 12,136 $ 1,095 $ 865 $ 1,180 $ 685 $ 1,011 $ 7,300
Commitment Expiration per Period
After
($ in millions) Total 2003 2004 2005 2006 2007 5 years
Standby and import letters of credit(1) $206$206$—$—$—$—$—
Surety bonds(2) 9898—————
Guarantees(3) 277 26 54 29 40 27 101
Tot al $ 581 $ 330 $ 54 $ 29 $ 40 $ 27 $ 101
(1) Standby letters of credit ($156 million at year-end) are issued as collateral to a third-party administrator for self-insured workers’ compensation and general liability claims.
(2) Surety bonds are primarily for previously incurred and expensed obligations related to workers’ compensation and general liability claims.
(3) Includes guarantees of $185 million on building and equipment leases operated by third parties, $43 million on loans related to a real estate investment trust, $29 million on
certain leases related to stores that were sold in 1997, of which $22 million is recorded in other liabilities and $20 million related to a third party reinsurance guarantee.