JCPenney 2002 Annual Report Download - page 27
Download and view the complete annual report
Please find page 27 of the 2002 JCPenney annual report below. You can navigate through the pages in the report by either clicking on the pages listed below, or by using the keyword search tool below to find specific information within the annual report.-
 1
1 -
2
-
3
-
4
-
5
-
6
-
7
-
8
-
9
-
10
-
11
-
12
-
13
-
14
-
15
-
16
-
 17
17 -
 18
18 -
 19
19 -
 20
20 -
 21
21 -
 22
22 -
 23
23 -
 24
24 -
 25
25 -
 26
26 -
 27
27 -
 28
28 -
 29
29 -
 30
30 -
 31
31 -
 32
32 -
 33
33 -
 34
34 -
 35
35 -
 36
36 -
 37
37 -
38
-
39
-
40
-
41
-
42
-
43
-
44
-
45
-
46
-
47
-
48
 |
 |

J. C. Penney Company, Inc. 2002 annual report24
Notes to the Consolidated Financial Statements
(net of tax) are added back to income, since these would not be
paid if the debentures or preferred stock were converted to com-
mon stock.
Stock-Based Compensation
The Company has a stock-based compensation plan, which is
discussed more fully in Note 12. The Company accounts for the
plan under the recognition and measurement principles of
Accounting Principles Board Opinion No. 25, “Accounting for
Stock Issued to Employees” (APB 25), and related Interpretations.
No stock-based employee compensation cost is reflected in net
income for stock options, as all options granted under the plan
had an exercise price equal to the market value of the underly-
ing common stock on the date of grant. Compensation expense
for restricted stock awards with pro rata vesting is recorded on a
straight-line basis over the vesting period, which typically ranges
from one to five years.
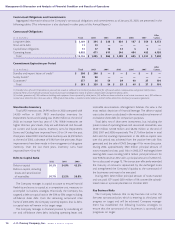
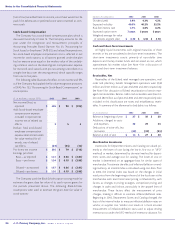
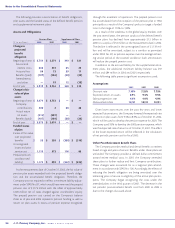
The following table illustrates the effect on net income and EPS
as if the Company had applied the fair value recognition provisions
of SFAS No. 123, “Accounting for Stock-Based Compensation,” to
stock options.
($ in millions, except EPS) 2002 2001 2000
Net income/(loss), as
reported $ 405 $ 98 $ (705)
Add: Stock-based employee
compensation expense
included in reported net
income, net of related tax
effects 354
Deduct: Total stock-based
employee compensation
expense determined under
fair value method for all
awards, net of related
tax effects (23) (24) (14)
Pro forma net income $ 385 $ 79 $ (715)
Earnings per share:
Basic—as reported $ 1.41 $ 0.26 $ (2.81)
Basic—pro forma $ 1.34 $ 0.19 $ (2.86)
Diluted—as reported $ 1.37 $ 0.26 $ (2.81)
Diluted—pro forma $ 1.30 $ 0.19 $ (2.86)
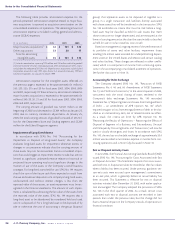
The Company used the Black-Scholes option-pricing model to
estimate the grant date fair value of its stock option grants for
the periods presented above. The following Black-Scholes
assumptions were used to estimate the grant date fair value of
stock options:
Option Assumptions 2002 2001 2000
Dividend yield 3.9% 4.2% 4.2%
Expected volatility 40.0% 40.2% 35.2%
Risk-free interest rate 4.7% 4.8% 6.2%
Expected option term 7 years 5 years 5 years
Weighted-average fair value
of options at grant date $ 6.32 $ 4.36 $ 3.78
Cash and Short-Term Investments
All highly liquid investments with original maturities of three
months or less are considered to be short-term investments. The
short-term investments consist primarily of euro-dollar time
deposits and money market funds and are stated at cost, which
approximates fair market value. See Note 4 for a discussion of
restricted short-term investment balances.
Receivables, Net
Receivables of the Eckerd retail managed care operations, mail
order and pharmacy benefit management operations were $338
million and $341 million as of year-end 2002 and 2001, respectively.
See Note 5 for discussion of Eckerd securitization of certain man-
aged care receivables. Renner credit card receivables were $66 mil-
lion and $80 million as of year-end 2002 and 2001, respectively. Also
included in this classification are notes and miscellaneous receiv-
ables. A summary of the allowance for bad debts is as follows:
($ in millions) 2002 2001 2000
Balance at beginning of year $27$30$20
Additions, charged to costs
and expenses 32 29 33
Deductions of write-offs, less
recoveries (45) (32) (23)
Balance at end of year $14$27 $ 30
Merchandise Inventories
Inventories for Department Stores and Catalog are valued pri-
marily at the lower of cost (using the last-in, first-out or “LIFO”
method) or market, determined by the retail method for depart-
ment stores and average cost for catalog. The lower of cost or
market is determined on an aggregate basis for similar types of
merchandise. To estimate the effects of inflation/deflation on end-
ing inventory, an internal index is calculated using cost data. Prior
to 2002, the internal index was based on the changes in initial
retail prices from the beginning to the end of the fiscal year at the
merchandise item level. Initial retail pricing is influenced by such
factors as: changes in pricing strategies, competitive pricing and
changes in styles and fashion, particularly in the apparel lines of
merchandise. These factors affect the measurement of price
changes, making it difficult to estimate inflation/deflation rates.
Beginning in 2002, Department Stores and Catalog changed the
basis of the internal index to measure inflation/deflation rates on
vendor, or supplier cost. Vendor cost results in a more accurate
measurement of inflation/deflation rates used to adjust ending
inventory cost under the LIFO method of inventory valuation. For