JCPenney 2002 Annual Report Download - page 13
Download and view the complete annual report
Please find page 13 of the 2002 JCPenney annual report below. You can navigate through the pages in the report by either clicking on the pages listed below, or by using the keyword search tool below to find specific information within the annual report.-
 1
1 -
2
-
 3
3 -
 4
4 -
 5
5 -
 6
6 -
 7
7 -
 8
8 -
 9
9 -
 10
10 -
 11
11 -
 12
12 -
 13
13 -
 14
14 -
 15
15 -
 16
16 -
 17
17 -
 18
18 -
 19
19 -
 20
20 -
 21
21 -
 22
22 -
 23
23 -
24
-
25
-
26
-
27
-
28
-
29
-
30
-
31
-
32
-
33
-
34
-
35
-
36
-
37
-
38
-
39
-
40
-
41
-
42
-
43
-
44
-
45
-
46
-
47
-
48
 |
 |

J. C. Penney Company, Inc. 2002 annual report10
Management’s Discussion and Analysis of Financial Condition and Results of Operations
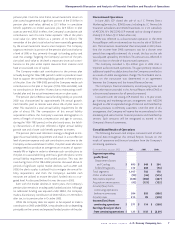
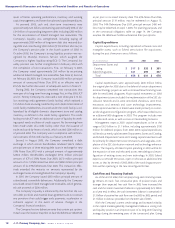
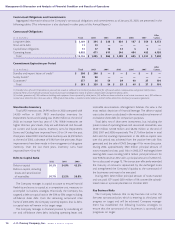
Eckerd Drugstores Operating Results
($ in millions) 2002 2001 2000
Retail sales, net $ 14,643 $ 13,847 $ 13,088
FIFO gross margin 3,439 3,160 2,906
LIFO (charge) (20) (47) (55)
LIFO gross margin 3,419 3,113 2,851
SG&A expenses (3,007) (2,905) (2,927)
Segment operating
profit/(loss) $ 412 $ 208 $ (76)
Sales percent increase:
Tot al sale s 5.7% 5.8% 5.3%
Comparable stores(1) 5.2% 7.8% 8.5%
Ratios as a percent of sales:
FIFO gross margin 23.5% 22.8% 22.2%
LIFO gross margin 23.3% 22.5% 21.8%
SG&A expenses 20.5% 21.0% 22.4%
LIFO segment operating
profit/(loss) 2.8% 1.5% (0.6)%
(1) Comparable store sales include the sales of stores after having been open at least
one full year. Comparable store sales include sales of relocated stores.
2002 compared with 2001. Segment operating profit for Eckerd
increased 130 basis points as a percent of sales to $412 million in
2002 from $208 million in 2001. 2002 marks the second consecutive
year that segment operating profits for Eckerd have improved by
more than 100 basis points. This increase is due to comparable
drugstore sales gains, gross margin improvements, improved inven-
tory turns and leveraging of SG&A expenses. Comparable drug-
store sales grew 5.2%, led by a 7.6% increase in pharmacy sales.
General merchandise, or front-end, sales were up slightly, increasing
0.6% over 2001. The new reconfigured drugstore format, which has
been rolled out to about 1,500 drugstores, contributed to the sales
gains along with more competitive everyday pricing, supported by
a more effective marketing program. Pharmacy sales were negative-
ly impacted by approximately 240 basis points from the effects of
increased sales of lower priced higher margin generic drugs, the
effects of other branded drugs such as Claritin coming off brand,
reduced sales of Estrogen, as well as a general slowdown in con-
sumer spending. Additionally, competitor unit openings in markets
such as Florida and Houston and a slowdown in tourism have also
negatively impacted sales. Pharmacy sales increased to 68.3% of
total drugstore sales, up from 66.9% last year. The managed care mix
increased 120 basis points to 92.6% of total pharmacy sales com-
pared to 91.4% in 2001. The strongest general merchandise cate-
gories were household products, beverages, baby and hygiene
products, seasonal items, over-the-counter drugs, food and snacks.
Sales were soft in photo processing. Overall, however, Eckerd
increased its Express Photo market share.
LIFO gross margin improved 80 basis points to 23.3% of sales
due to the continuing shift to more profitable generic drug sales,
improved shrinkage trends, good sell through of holiday merchan-
dise, a better product mix and improved procurement practices.
Pressure was put on general merchandise margins as a result of a
promotional environment and implementing a more competitive
everyday pricing throughout the drugstore chain. Included in 2002
gross margin was a LIFO charge of $20 million, primarily due to
price inflation on prescription drugs, partially offset by deflation in
certain general merchandise categories and declines in inventory
levels. The $47 million LIFO charge in 2001 was primarily from price
inflation on prescription drugs.
As a percent of sales, SG&A expenses improved by 50 basis
points to 20.5% of sales in 2002, in addition to a 140 basis point
improvement in 2001. SG&A expenses as a percent of sales con-
tinue to improve as a result of efficiencies generated by the recon-
figured drugstore format, the elimination of redundancies in back
office operations, more efficient distribution and the in-sourcing
of information technology, as well as the leverage generated by
higher sales. Also included in 2002 SG&A is a net $3 million gain
for Eckerd’s co-plaintiff position in an antitrust settlement for liti-
gation with manufacturers, partially offset by a reserve established
for Eckerd’s pharmacy benefit management business.
The Company has just completed the second year of its stat-
ed three-year turnaround program for the Eckerd drugstore busi-
ness. The focus has been on developing a strong management
team, including key external hires, enhancing product offerings,
implementing competitive pricing for general merchandise and
rolling out a reconfiguration program to a new, more productive
and efficient drugstore format. The successful continuation of
the Eckerd turnaround is dependent on Eckerd’s ability to suc-
cessfully attract and retain customers through various marketing
and merchandising programs, to secure suitable new drugstore
locations at favorable lease terms, to continue the reconfigura-
tion and remodeling program for drugstores, to attract and
retain qualified pharmacists, and to maintain favorable reim-
bursement rates from managed care organizations, governmen-
tal and other third party payors.
2001 compared with 2000. Segment operating profit for
Eckerd improved 210 basis points as a percent of sales to $208 mil-
lion in 2001 compared to a loss of $76 million in 2000. The
increase in segment operating profit resulted from comparable
store sales increases, with higher general merchandise sales, com-
bined with improved SG&A expenses.
Sales reflected increases in transaction volumes and unit sales from
reduced pricing, improved marketing and store reconfiguration ini-
tiatives. Comparable sales growth for 2001 was led by an 11.7%
increase in pharmacy sales, which accounted for 66.9% of total drug-
store sales. Pharmacy sales increased in the managed care business,
which accounted for 91.4% of pharmacy sales, up from 89.5% in 2000.
Comparable general merchandise sales increased 1.0% for the year,
despite reducing prices on 5,000 items by approximately 6% and
implementing temporary low pricing on 1,000 items. The strongest
general merchandise categories were cosmetics and skin care, baby
and hygiene products, household products, candy, food and snacks,
including beverages. The store reconfiguration program, which repre-
sents a new store layout, was rolled out to approximately 700 drug-
stores in 2001. At the end of 2001, approximately 25% of all drug-
stores were operating in the new format.