JCPenney 2002 Annual Report Download - page 10
Download and view the complete annual report
Please find page 10 of the 2002 JCPenney annual report below. You can navigate through the pages in the report by either clicking on the pages listed below, or by using the keyword search tool below to find specific information within the annual report.-
 1
1 -
 2
2 -
 3
3 -
 4
4 -
 5
5 -
 6
6 -
 7
7 -
 8
8 -
 9
9 -
 10
10 -
 11
11 -
 12
12 -
 13
13 -
 14
14 -
 15
15 -
 16
16 -
 17
17 -
 18
18 -
 19
19 -
 20
20 -
 21
21 -
22
-
23
-
24
-
25
-
26
-
27
-
28
-
29
-
30
-
31
-
32
-
33
-
34
-
35
-
36
-
37
-
38
-
39
-
40
-
41
-
42
-
43
-
44
-
45
-
46
-
47
-
48
 |
 |

2002 annual report J. C. Penney Company, Inc. 7
Management’s Discussion and Analysis of Financial Condition and Results of Operations
pension plan. Over this time frame, actual investment return on
plan assets has generated a significant portion of the $5 billion in
pension plan total value, defined as $2.1 billion in cumulative
benefit payments to retired associates plus $2.9 billion in plan
assets at year-end 2002. In effect, the Company’s cumulative cash
contributions over this time frame represent 13% of the plan’s
total value (i.e., $650 million as a percent of $5 billion). The
remainder of the plan’s total value has been essentially generated
by the actual investment returns since inception. The Company
targets to maintain its portion of the pension plan’s total value to
a level of 20% or less, primarily through its funding policy and
asset mix strategy. Targeting the Company’s portion of the pen-
sion plan’s total value at this level is important since cash contri-
butions to the plan utilize capital resources from investors and
have an associated cost of capital.
The Company made cash contributions to the primary plan
annually during the 1966-1983 period in order to provide an asset
base to support the accelerating liability growth in the early years
of the plan. Over the 1984-2002 period the Company made cash
contributions to the plan in five years (1993-1996 and 2002), and
no contributions in the other 14 years due to maintaining a well-
funded plan and the actual investment return on plan assets.
The pension plan’s ERISA actuarial funding liability at year-end
2002 was characterized by approximately 3% annual growth.
Cash benefits paid to retirees were about 6% of plan assets in
2002. This resulted in a total annual liability requirement for the
plan of about 9%. The composition of this annual liability
requirement reflects the Company’s associate demographics in
terms of length of service, compensation and age. In contrast,
during the 1966-1983 period, or the plan’s early years, the liabili-
ty characteristics of the plan reflected a higher annual liability
growth rate and a lower cash benefit payment to retirees.
The pension plan’s asset allocation strategy is designed to mit-
igate this annual liability requirement and result in a cost effective
level of pension expense and cash contributions over time to the
Company as discussed above. In effect, the plan’s asset allocation
strategy needs to produce an average return on assets of approx-
imately 9% or higher in order to eliminate cash contributions to
the plan on a sustainable long-term basis, given the plan’s current
annual liability requirement and funded position. This was the
case during most of the 1984-2002 period as discussed above. In
periods of significant capital market declines, such as 2001 and
2002, the plan’s surplus is utilized first to mitigate the annual lia-
bility requirement, and then the Company’s available cash
resources are utilized to restore the plan’s funded ratio to a tar-
geted level. As discussed below, this was the case in 2002.
Even with the market declines in recent years, the Company’s
pension plan remains in an adequately funded position. Although
no additional funding was required under ERISA, the Company
made a discretionary contribution of $300 million, or $190 million
after tax, to its pension plan in October 2002.
While the Company does not expect to be required to make a
contribution in 2003 under ERISA, it may decide to do so depending
principally on the current and expected funded position of the plan.
Discontinued Operations
In June 2001, JCP closed the sale of its J. C. Penney Direct
Marketing Services, Inc. (DMS) assets, including its J. C. Penney Life
Insurance subsidiaries and related businesses, to a U.S. subsidiary
of AEGON, N.V. (AEGON). JCP received cash at closing of approx-
imately $1.3 billion ($1.1 billion after tax).
DMS was reflected as a discontinued operation in the 2000
Annual Report with an estimated net loss on the sale of $296 mil-
lion. The transaction closed earlier than anticipated in 2001; there-
fore, the income from DMS operations was for a shorter time
period than originally estimated. As a result, the loss on the sale
was adjusted upward by $16 million. This amount was reflected in
2001 as a loss on the sale of discontinued operations.
The Company recorded a $34 million gain in 2002 that is
reported as discontinued operations. This gain primarily relates to
additional capital loss deductions that the Company is entitled to
as a result of a 2002 tax regulation change. The final federal tax lia-
bility on the transaction was determined in an agreement
between the Company and the Internal Revenue Service.
The Company’s financial statements, accompanying notes and
other information provided in this Annual Report reflect DMS as
a discontinued operation for all periods presented.
Concurrent with the closing, JCP entered into a 15-year strate-
gic licensing and marketing services arrangement with AEGON
designed to offer an expanded range of financial and membership
services products to JCPenney customers. Over the term of this
arrangement, the Company will receive fee income related to the
marketing and sale of certain financial products and membership
services. Such amounts will be recognized as earned in the
Company’s financial statements.
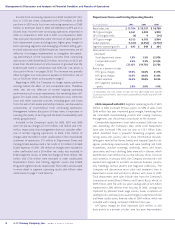
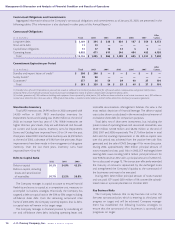
Consolidated Results of Operations
The following discussion and analysis, consistent with all other
financial data throughout this Annual Report, focuses on the
results of operations and financial condition from the Company’s
continuing operations.
($ in millions, except EPS) 2002 2001 2000
Segment operating
profit/(loss)
Department Stores
and Catalog $ 695 $ 548 $ 254
Eckerd Drugstores 412 208 (76)
Tot al segm ents 1,107 756 178
Other unallocated (93) (46) (515)
Net interest expense (388) (386) (427)
Acquisition amortization (42) (121) (122)
Income/(loss) from
continuing operations
before income taxes 584 203 (886)
Income taxes 213 89 (318)
Income/(loss) from
continuing operations $ 371 $ 114 $ (568)
Earnings/(loss) per share
from continuing operations $ 1.25 $ 0.32 $ (2.29)