JCPenney 2002 Annual Report Download - page 42
Download and view the complete annual report
Please find page 42 of the 2002 JCPenney annual report below. You can navigate through the pages in the report by either clicking on the pages listed below, or by using the keyword search tool below to find specific information within the annual report.-
 1
1 -
2
-
3
-
4
-
5
-
6
-
7
-
8
-
9
-
10
-
11
-
12
-
13
-
14
-
15
-
16
-
17
-
18
-
19
-
20
-
21
-
22
-
23
-
24
-
25
-
26
-
27
-
28
-
29
-
30
-
31
-
 32
32 -
 33
33 -
 34
34 -
 35
35 -
 36
36 -
 37
37 -
 38
38 -
 39
39 -
 40
40 -
 41
41 -
 42
42 -
 43
43 -
 44
44 -
 45
45 -
 46
46 -
 47
47 -
 48
48
 |
 |

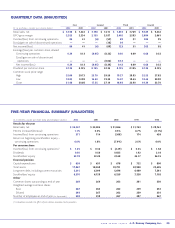
2002 annual report J. C. Penney Company, Inc. 39
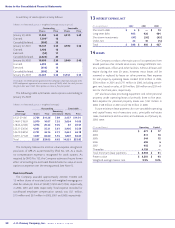
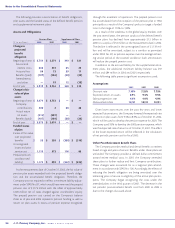
QUARTERLY DATA (UNAUDITED)
First Second Third Fourth
($ in millions, except per share data) 2002 2001 2002 2001 2002 2001 2002 2001
Retail sales, net $ 7,728 $ 7,522 $ 7,198 $ 7,211 $ 7,872 $ 7,729 $ 9,549 $ 9,542
LIFO gross margin 2,353 2,234 2,135 2,037 2,402 2,283 2,884 2,661
Income/(loss) from continuing operations 86 41 (6) (53) 89 31 202 95
(Loss)/gain on sale of discontinued operations ———(16) 34 ———
Net income/(loss) 86 41 (6) (69) 123 31 202 95
Earnings/(loss) per common share, diluted:
Continuing operations 0.29 0.13 (0.05) (0.23) 0.30 0.09 0.68 0.32
(Loss)/gain on sale of discontinued
operations ———(0.06) 0.12———
Net income/(loss) 0.29 0.13 (0.05) (0.29) 0.42 0.09 0.68 0.32
Dividend per common share 0.125 0.125 0.125 0.125 0.125 0.125 0.125 0.125
Common stock price range:
High 25.00 20.73 25.70 29.50 19.27 28.85 25.55 27.82
Low 18.83 12.98 14.50 19.30 14.07 18.64 18.45 20.90
Close 21.46 20.66 17.55 27.14 18.92 23.90 19.39 23.70
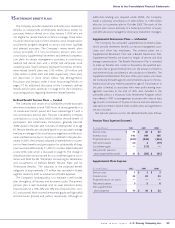
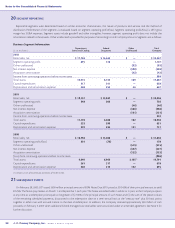
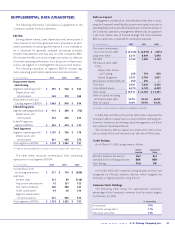
FIVE-YEAR FINANCIAL SUMMARY (UNAUDITED)
($ in millions, except per share data and employee counts) 2002 2001 2000 1999 1998
Results for the year
Retail sales, net $ 32,347 $ 32,004 $ 31,846 $ 31,743 $ 29,761
Percent increase/(decrease) 1.1% 0.5% 0.3% 6.7% (0.1%)
Income/(loss) from continuing operations 371 114 (568) 174 438
Return on beginning stockholders’ equity –
continuing operations 6.0% 1.8% (7.9%) 2.5% 6.0%
Per common share
Income/(loss) from continuing operations(1) $ 1.25 $ 0.32 $ (2.29) $ 0.54 $ 1.58
Dividends 0.50 0.50 0.825 1.92 2.18
Stockholders’ equity 22.78 22.20 22.68 26.17 26.74
Financial position
Capital expenditures $ 658 $ 631 $ 678 $ 722 $ 800
Total assets 17,867 18,048 19,791 20,908 23,605
Long-term debt, including current maturities 5,215 6,099 5,698 6,469 7,581
Stockholders’ equity 6,370 6,129 6,259 7,228 7,102
Other
Common shares outstanding at end of year 269 264 263 261 250
Weighted average common shares:
Basic 267 263 262 259 253
Diluted 293 267 262 259 254
Number of employees at end of year (in thousands) 228 238 267 287 267
(1) Calculation excludes the effects of anti-dilutive common stock equivalents.