JCPenney 2002 Annual Report Download - page 11
Download and view the complete annual report
Please find page 11 of the 2002 JCPenney annual report below. You can navigate through the pages in the report by either clicking on the pages listed below, or by using the keyword search tool below to find specific information within the annual report.-
 1
1 -
 2
2 -
 3
3 -
 4
4 -
 5
5 -
 6
6 -
 7
7 -
 8
8 -
 9
9 -
 10
10 -
 11
11 -
 12
12 -
 13
13 -
 14
14 -
 15
15 -
 16
16 -
 17
17 -
 18
18 -
 19
19 -
 20
20 -
 21
21 -
 22
22 -
23
-
24
-
25
-
26
-
27
-
28
-
29
-
30
-
31
-
32
-
33
-
34
-
35
-
36
-
37
-
38
-
39
-
40
-
41
-
42
-
43
-
44
-
45
-
46
-
47
-
48
 |
 |

J. C. Penney Company, Inc. 2002 annual report8
Management’s Discussion and Analysis of Financial Condition and Results of Operations
Income from continuing operations in 2002 totaled $371 mil-
lion, or $1.25 per share, compared with $114 million, or $0.32
per share in 2001 and a loss from continuing operations of $568
million, or $2.29 per share in 2000. All references to EPS are on a
diluted basis. Income from continuing operations improved in
2002 as compared to 2001 and in 2001 as compared to 2000.
Year-over-year improvements were the result of sales growth in
both department stores and drugstores, higher gross margin in
both operating segments and leveraging of Eckerd selling, gen-
eral and administrative (SG&A) expenses. Improvements are all
reflective of strategies implemented to strengthen the operat-
ing performance of the businesses. Income from continuing
operations in 2002 benefited $72 million, net of tax, or $0.27 per
share from the elimination of amortization of goodwill and the
Eckerd trade name in compliance with SFAS No. 142, which is
discussed in Note 1 on pages 25-26. This increase was partially
offset by higher non-cash pension expense of $59 million, net of
tax, or $0.20 per share, as discussed on page 6.
Beginning in 2002, the Company no longer reports proforma
earnings before the effect of non-comparable items. Therefore,
items that are not reflective of normal ongoing operating
performance such as asset impairments, the remaining lease obli-
gation for closed stores, involuntary termination costs, other exit
costs and other corporate activities, including gains and losses
from the sale of real estate partnership interests, are discussed as
components of income/(loss) from continuing operations.
Management believes discussion of these items is important in
assessing the quality of earnings and the level of sustainability and
trends going forward.
Included in the Company’s results for 2002, 2001 and 2000
were net pre-tax charges of $119 million, $36 million and $751
million, respectively, that management does not consider reflec-
tive of normal ongoing operations. In 2002, $105 million of
charges were recorded in other unallocated in the consolidated
statement of operations, $17 million in Department Stores and
Catalog SG&A expenses and a net credit of $3 million in Eckerd
SG&A expenses. In 2001, $42 million of charges were included in
other unallocated and a $6 million net credit was recorded in
Eckerd segment results. In 2000, net charges of $543 million, $92
million and $116 million were recorded in other unallocated,
Department Stores and Catalog segment results and Eckerd
Drugstore segment results, respectively. These items are discussed
in more detail in segment operating results that follow, other
unallocated on page 11 and Note 16.
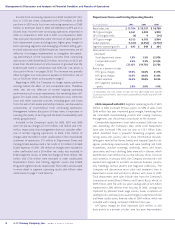
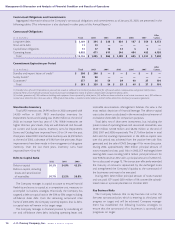
Department Stores and Catalog Operating Results
($ in millions) 2002 2001 2000
Retail sales, net $ 17,704 $ 18,157 $ 18,758
FIFO gross margin 6,361 6,093 5,978
LIFO (charge)/credit (6) 9 (14)
LIFO gross margin 6,355 6,102 5,964
SG&A expenses (5,660) (5,554) (5,710)
Segment operating profit $ 695 $ 548 $ 254
Sales percent increase/
(decrease):
Total department stores 1.9% 1.5% (2.9)%
Comparable stores(1) 2.6% 3.3% (2.4)%
Catalog (22.0)% (19.7)% (2.7)%
Ratios as a percent of sales:
FIFO gross margin 35.9% 33.6% 31.9%
LIFO gross margin 35.9% 33.6% 31.8%
SG&A expenses 32.0% 30.6% 30.4%
LIFO segment operating
profit 3.9% 3.0% 1.4%
(1) Comparable store sales include the sales of stores after having been open for
12 consecutive fiscal months. Stores become comparable on the first day of the 13th
fiscal month.
2002 compared with 2001. Segment operating profit of $695
million in 2002 increased 90 basis points to 3.9% of sales, from
$548 million last year. Improved gross margin, benefiting from
the centralized merchandising process and catalog inventory
management, was the primary contributor to the increase.
Comparable department store sales increased 2.6% over last
year, exceeding the Company’s plan, while total department
store sales increased 1.9% over last year to $15.1 billion. Sales,
which benefited from a powerful marketing program, were
strong across the country and in most merchandise divisions.
Sales gains were led by Home, Jewelry and Apparel. Specific cat-
egories performing exceptionally well were bedding and bath,
housewares, window coverings, diamonds, men’s and misses
sportswear, and boys’ clothing. Sales were soft in dresses, which
experienced lower demand across the industry, shoes, furniture
and cosmetics. In January 2003, the Company announced it will
expand and upgrade its women’s accessories business, particu-
larly handbags, fashion jewelry and fragrance collections. The
Company will discontinue most color and treatment lines in
department stores and will end its alliance with Avon in 2003.
Total department store sales include sales from the Company’s
international stores (Brazil, Mexico and Puerto Rico), which, at
$499 million, were flat with last year. Catalog sales of $2.6 billion
represented a 22% decline from last year. In 2002, catalog was
impacted by planned lower page counts, lower circulation of
catalog books, previously discussed changes to payment policies
and fewer outlet stores. Internet sales of $381 million, which are
included with catalog, increased 17.8% from last year.
LIFO gross margin for 2002 improved $253 million, or 230
basis points as a percent of sales, over last year. Improvement