JCPenney 2002 Annual Report Download - page 31
Download and view the complete annual report
Please find page 31 of the 2002 JCPenney annual report below. You can navigate through the pages in the report by either clicking on the pages listed below, or by using the keyword search tool below to find specific information within the annual report.-
 1
1 -
2
-
3
-
4
-
5
-
6
-
7
-
8
-
9
-
10
-
11
-
12
-
13
-
14
-
15
-
16
-
17
-
18
-
19
-
20
-
 21
21 -
 22
22 -
 23
23 -
 24
24 -
 25
25 -
 26
26 -
 27
27 -
 28
28 -
 29
29 -
 30
30 -
 31
31 -
 32
32 -
 33
33 -
 34
34 -
 35
35 -
 36
36 -
 37
37 -
 38
38 -
 39
39 -
 40
40 -
 41
41 -
42
-
43
-
44
-
45
-
46
-
47
-
48
 |
 |

J. C. Penney Company, Inc. 2002 annual report28
Notes to the Consolidated Financial Statements
• The $650 million aggregate principal amount of subordinated notes issued in October 2001 and convertible into approximately 22.8
million shares of common stock were excluded from the 2001 calculation. These notes are convertible at any time prior to maturity,
unless previously redeemed, at the option of the holders into shares of common stock at a conversion price of $28.50 per share, sub-
ject to certain adjustments.
• Outstanding preferred stock convertible into 11 million, 12 million and 13 million common shares at January 25, 2003, January 26, 2002
and January 27, 2001, respectively, were excluded from the 2002, 2001 and 2000 calculations, respectively.
• For 2000, restricted stock units convertible into 1.4 million shares of stock were excluded from the calculations.
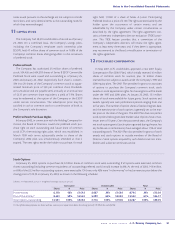
The computation of basic and diluted EPS follows:
(in millions, except per share data) Income/(Loss) Average Shares EPS
2002
Income from continuing operations $ 371
Less: preferred stock dividends 27
Continuing operations – basic 344 267 $1.28
Effect of dilutive securities:
Stock options and restricted stock units —3
5% convertible debt 23 23
Continuing operations – diluted 367 293 1.25
Gain on sale of discontinued operations 34
Basic 267 0.13
Diluted 293 0.12
Net income
Basic $ 378 267 $1.41
Diluted $ 401 293 $1.37
2001
Income from continuing operations $ 114
Less: preferred stock dividends 29
Continuing operations – basic 85 263 $0.32
Stock options and restricted stock units —4
Continuing operations – diluted 85 267 0.32
(Loss) on sale of discontinued operations (16)
Basic 263 (0.06)
Diluted 267 (0.06)
Net income $ 69
Basic 263 $0.26
Diluted 267 $0.26
2000
(Loss) from continuing operations $ (568)
Less: preferred stock dividends 33
Continuing operations – basic/diluted (601) 262 $(2.29)
Discontinued operations – basic/diluted 159 262 0.61
(Loss) on sale of discontinued operations – basic/diluted (296) 262 (1.13)
Net (loss) – basic/diluted $ (738) 262 $(2.81)