Honda 2011 Annual Report Download - page 73
Download and view the complete annual report
Please find page 73 of the 2011 Honda annual report below. You can navigate through the pages in the report by either clicking on the pages listed below, or by using the keyword search tool below to find specific information within the annual report.-
 1
1 -
2
-
3
-
4
-
5
-
6
-
7
-
8
-
9
-
10
-
11
-
12
-
13
-
14
-
15
-
16
-
17
-
18
-
19
-
20
-
21
-
22
-
23
-
24
-
25
-
26
-
27
-
28
-
29
-
30
-
31
-
32
-
33
-
34
-
35
-
36
-
37
-
38
-
39
-
40
-
41
-
42
-
43
-
44
-
45
-
46
-
47
-
48
-
49
-
50
-
51
-
52
-
53
-
54
-
55
-
56
-
57
-
58
-
59
-
60
-
61
-
62
-
 63
63 -
 64
64 -
 65
65 -
 66
66 -
 67
67 -
 68
68 -
 69
69 -
 70
70 -
 71
71 -
 72
72 -
 73
73 -
 74
74 -
 75
75 -
 76
76 -
 77
77 -
 78
78 -
 79
79 -
 80
80
 |
 |

Yen (millions)
2010 2011
Non-financial Non-financial
services Finance Reconciling services Finance Reconciling
Years ended March 31, 2010 and 2011 businesses subsidiaries items Consolidated businesses subsidiaries items Consolidated
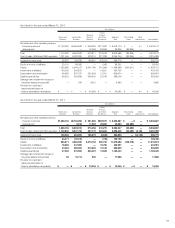
Cash flows from operating activities:
Net income ¥ 176,370 ¥ 106,241 ¥ — ¥ 282,611 ¥ 456,181 ¥107,296 ¥ — ¥ 563,477
Adjustments to reconcile net
income to net cash provided
by operating activities:
Depreciation 399,221 230,453 — 629,674 349,834 213,805 — 563,639
Deferred income taxes 20,622 35,984 — 56,606 28,691 101,489 — 130,180
Equity in income of affiliates (93,282) — — (93,282) (139,756) — — (139,756)
Dividends from affiliates 140,901 — — 140,901 98,182 — — 98,182
Gain on sales of investments
in affiliates — — — — (46,756) — — (46,756)
Impairment loss on investments
in securities 603 — — 603 2,133 — — 2,133
Damaged and impairment loss on
long-lived assets and goodwill 548 3,312 — 3,860 16,833 835 — 17,668
Loss (gain) on derivative
instruments, net (6,683) (31,070) — (37,753) 670 (8,458) — (7,788)
Decrease (increase) in trade
accounts and notes receivable (67,982) 63,763 (2,691) (6,910) 26,837 12,413 (550) 38,700
Decrease (increase) in inventories 352,994 — — 352,994 (33,676) — — (33,676)
Increase (decrease) in trade
accounts and notes payable 153,440 — (2,095) 151,345 (50,618) — (4,713) (55,331)
Other, net 22,892 28,393 12,278 63,563 (73,797) 13,342 620 (59,835)
Net cash provided by (used in)
operating activities 1,099,644 437,076 7,492 1,544,212 634,758 440,722 (4,643) 1,070,837
Cash flows from investing activities:
Decrease (increase) in investments
and advances 106,565 (5,878) (121,852) (21,165) (41,730) 4,951 16,865 (19,914)
Proceeds from sales of investments
in affiliates — — — — 71,073 — — 71,073
Capital expenditures (389,747) (2,315) — (392,062) (316,472) (2,071) — (318,543)
Proceeds from sales of property,
plant and equipment 24,132 340 — 24,472 24,089 636 — 24,725
Decrease (increase) in finance
subsidiaries–receivables — 87,571 4,350 91,921 — (90,859) (7,717) (98,576)
Purchase of operating lease assets — (544,027) — (544,027) — (798,420) — (798,420)
Proceeds from sales of operating
lease assets — 245,110 — 245,110 — 408,265 — 408,265
Net cash used in
investing activities (259,050) (219,199) (117,502) (595,751) (263,040) (477,498) 9,148 (731,390)
Cash flows from financing activities:
Increase (decrease) in short-term
debt, net (458,642) (304,264) 113,265 (649,641) 11,270 107,495 (5,096) 113,669
Proceeds from long-term debt 115,120 1,023,804 (6,702) 1,132,222 18,174 786,399 (5,053) 799,520
Repayment of long-term debt (25,285) (941,995) 3,447 (963,833) (27,539) (848,511) 5,644 (870,406)
Dividends paid (61,696) — — (61,696) (92,170) — — (92,170)
Dividends paid to
noncontrolling interests (16,278) — — (16,278) (16,232) — — (16,232)
Sales (purchase) of treasury stock, net (18) — — (18) (34,797) — — (34,797)
Net cash provided by (used in)
financing activities (446,799) (222,455) 110,010 (559,244) (141,294) 45,383 (4,505) (100,416)
Effect of exchange rate changes
on cash and cash equivalents 38,786 1,530 — 40,316 (78,757) (1,152) — (79,909)
Net change in cash and
cash equivalents 432,581 (3,048) — 429,533 151,667 7,455 — 159,122
Cash and cash equivalents at
beginning of period 668,114 22,255 — 690,369 1,100,695 19,207 — 1,119,902
Cash and cash equivalents
at end of period ¥1,100,695 ¥ 19,207 ¥ — ¥1,119,902 ¥1,252,362 ¥ 26,662 ¥ — ¥1,279,024
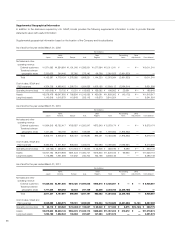
Notes:
1. Non-financial services businesses lend to finance subsidiaries. These cash flows are included in the decrease (increase) in investments and advances, increase (decrease) in short-term
debt, proceeds from long-term debt, and repayment of long-term debt. The amount of the loans to finance subsidiaries is a ¥121,852 million decrease for the fiscal year ended March
31, 2010, and a ¥16,865 million increase for the fiscal year ended March 31, 2011, respectively.
2. Decrease (increase) in trade accounts and notes receivable for finance subsidiaries is due to the reclassification of finance subsidiaries–receivables which relate to sales of inventory in
the unaudited consolidated statements of cash flows presented above.
71
Consolidated Statements of Cash Flows Divided into
Non-Financial Services Businesses and Finance Subsidiaries