Honda 2011 Annual Report Download - page 60
Download and view the complete annual report
Please find page 60 of the 2011 Honda annual report below. You can navigate through the pages in the report by either clicking on the pages listed below, or by using the keyword search tool below to find specific information within the annual report.-
 1
1 -
2
-
3
-
4
-
5
-
6
-
7
-
8
-
9
-
10
-
11
-
12
-
13
-
14
-
15
-
16
-
17
-
18
-
19
-
20
-
21
-
22
-
23
-
24
-
25
-
26
-
27
-
28
-
29
-
30
-
31
-
32
-
33
-
34
-
35
-
36
-
37
-
38
-
39
-
40
-
41
-
42
-
43
-
44
-
45
-
46
-
47
-
48
-
49
-
 50
50 -
 51
51 -
 52
52 -
 53
53 -
 54
54 -
 55
55 -
 56
56 -
 57
57 -
 58
58 -
 59
59 -
 60
60 -
 61
61 -
 62
62 -
 63
63 -
 64
64 -
 65
65 -
 66
66 -
 67
67 -
 68
68 -
 69
69 -
 70
70 -
71
-
72
-
73
-
74
-
75
-
76
-
77
-
78
-
79
-
80
 |
 |

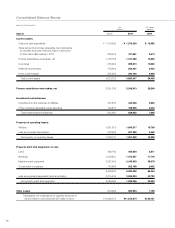
March 31, 2010 and 2011
Yen U.S. dollars
(millions) (millions)
Assets 2010 2011 2011
Current assets:
Cash and cash equivalents ¥ 1,119,902 ¥ 1,279,024 $ 15,382
Trade accounts and notes receivable, net of allowance
for doubtful accounts of ¥8,555 million in 2010 and
¥7,904 million ($95 million) in 2011 883,476 787,691 9,473
Finance subsidiaries–receivables, net 1,100,158 1,131,068 13,603
Inventories 935,629 899,813 10,822
Deferred income taxes 176,604 202,291 2,433
Other current assets 397,955 390,160 4,692
Total current assets 4,613,724 4,690,047 56,405
Finance subsidiaries–receivables, net 2,361,335 2,348,913 28,249
Investments and advances:
Investments in and advances to affiliates 457,834 440,026 5,292
Other, including marketable equity securities 184,847 199,906 2,404
Total investments and advances 642,681 639,932 7,696
Property on operating leases:
Vehicles 1,651,672 1,645,517 19,790
Less accumulated depreciation 343,525 287,885 3,462
Net property on operating leases 1,308,147 1,357,632 16,328
Property, plant and equipment, at cost:
Land 489,769 483,654 5,817
Buildings 1,509,821 1,473,067 17,716
Machinery and equipment 3,257,455 3,166,353 38,079
Construction in progress 143,862 202,186 2,432
5,400,907 5,325,260 64,044
Less accumulated depreciation and amortization 3,314,244 3,385,904 40,720
Net property, plant and equipment 2,086,663 1,939,356 23,324
Other assets 616,565 594,994 7,155
Total assets, net of allowance for doubtful accounts of
¥9,319 million in 2010 and ¥23,275 million in 2011 ¥11,629,115 ¥11,570,874 $139,157
58
Consolidated Balance Sheets