Honda 2011 Annual Report Download - page 67
Download and view the complete annual report
Please find page 67 of the 2011 Honda annual report below. You can navigate through the pages in the report by either clicking on the pages listed below, or by using the keyword search tool below to find specific information within the annual report.-
 1
1 -
2
-
3
-
4
-
5
-
6
-
7
-
8
-
9
-
10
-
11
-
12
-
13
-
14
-
15
-
16
-
17
-
18
-
19
-
20
-
21
-
22
-
23
-
24
-
25
-
26
-
27
-
28
-
29
-
30
-
31
-
32
-
33
-
34
-
35
-
36
-
37
-
38
-
39
-
40
-
41
-
42
-
43
-
44
-
45
-
46
-
47
-
48
-
49
-
50
-
51
-
52
-
53
-
54
-
55
-
56
-
 57
57 -
 58
58 -
 59
59 -
 60
60 -
 61
61 -
 62
62 -
 63
63 -
 64
64 -
 65
65 -
 66
66 -
 67
67 -
 68
68 -
 69
69 -
 70
70 -
 71
71 -
 72
72 -
 73
73 -
 74
74 -
 75
75 -
 76
76 -
 77
77 -
78
-
79
-
80
 |
 |

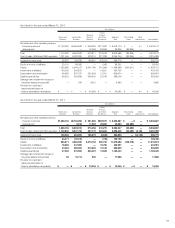
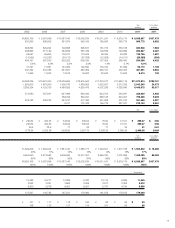
As of and for the year ended March 31, 2010
Yen (millions)
Power
Financial Product
Motorcycle Automobile Services and Other Segment Reconciling Other
Business Business Business Businesses Total Items Adjustments Consolidated
Net sales and other operating revenue:
External customers ¥1,140,292 ¥6,554,848 ¥ 606,352 ¥277,682 ¥ 8,579,174 ¥ — ¥— ¥ 8,579,174
Intersegment — — 12,459 26,936 39,395 (39,395) — —
Total 1,140,292 6,554,848 618,811 304,618 8,618,569 (39,395) — 8,579,174
Cost of sales, SG&A and R&D expenses 1,081,455 6,428,090 423,910 321,339 8,254,794 (39,395) — 8,215,399
Segment income (loss) 58,837 126,758 194,901 (16,721) 363,775 — — 363,775
Equity in income of affiliates 23,131 69,082 — 1,069 93,282 — — 93,282
Assets 1,025,665 5,044,247 5,541,788 281,966 11,893,666 (264,551) — 11,629,115
Investments in affiliates 103,032 334,875 — 16,821 454,728 — — 454,728
Depreciation and amortization 48,683 337,787 230,453 12,751 629,674 — — 629,674
Capital expenditures 38,332 284,586 546,342 23,748 893,008 — — 893,008
Damaged and impairment losses on
long-lived assets and goodwill — 548 3,312 — 3,860 — — 3,860
Provision for credit and
lease residual losses on
finance subsidiaries–receivables ¥ — ¥ — ¥ 40,062 ¥ — ¥ 40,062 ¥ — ¥— ¥ 40,062
As of and for the year ended March 31, 2011
Yen (millions)
Power
Financial Product
Motorcycle Automobile Services and Other Segment Reconciling Other
Business Business Business Businesses Total Items Adjustments Consolidated
Net sales and other operating revenue:
External customers ¥1,288,194 ¥6,794,098 ¥ 561,896 ¥292,679 ¥ 8,936,867 ¥ — ¥ — ¥ 8,936,867
Intersegment — 8,218 11,562 25,600 45,380 (45,380) — —
Total 1,288,194 6,802,316 573,458 318,279 8,982,247 (45,380) — 8,936,867
Cost of sales, SG&A and R&D expenses 1,149,600 6,537,766 387,179 323,804 8,398,349 (45,380) 14,123 8,367,092
Segment income (loss) 138,594 264,550 186,279 (5,525) 583,898 — (14,123) 569,775
Equity in income of affiliates 40,471 100,018 — (733) 139,756 — — 139,756
Assets 933,671 4,883,029 5,572,152 290,730 11,679,582 (108,708) — 11,570,874
Investments in affiliates 76,280 341,955 — 16,756 434,991 — — 434,991
Depreciation and amortization 40,324 296,364 213,805 13,146 563,639 — — 563,639
Capital expenditures 37,084 273,502 800,491 13,963 1,125,040 — — 1,125,040
Damaged and impairment losses on
long-lived assets and goodwill 59 16,774 835 — 17,668 — — 17,668
Provision for credit and
lease residual losses on
finance subsidiaries–receivables ¥ — ¥ — ¥ 13,305 ¥ — ¥ 13,305 ¥ — ¥ — ¥ 13,305
65