Honda 2011 Annual Report Download - page 70
Download and view the complete annual report
Please find page 70 of the 2011 Honda annual report below. You can navigate through the pages in the report by either clicking on the pages listed below, or by using the keyword search tool below to find specific information within the annual report.-
 1
1 -
2
-
3
-
4
-
5
-
6
-
7
-
8
-
9
-
10
-
11
-
12
-
13
-
14
-
15
-
16
-
17
-
18
-
19
-
20
-
21
-
22
-
23
-
24
-
25
-
26
-
27
-
28
-
29
-
30
-
31
-
32
-
33
-
34
-
35
-
36
-
37
-
38
-
39
-
40
-
41
-
42
-
43
-
44
-
45
-
46
-
47
-
48
-
49
-
50
-
51
-
52
-
53
-
54
-
55
-
56
-
57
-
58
-
59
-
 60
60 -
 61
61 -
 62
62 -
 63
63 -
 64
64 -
 65
65 -
 66
66 -
 67
67 -
 68
68 -
 69
69 -
 70
70 -
 71
71 -
 72
72 -
 73
73 -
 74
74 -
 75
75 -
 76
76 -
 77
77 -
 78
78 -
 79
79 -
 80
80
 |
 |

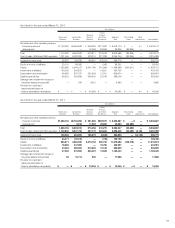
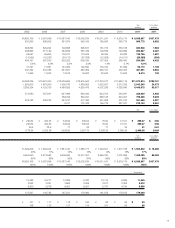
Supplemental Geographical Information
In addition to the disclosure required by U.S. GAAP, Honda provides the following supplemental information in order to provide financial
statements users with useful information:
Supplemental geographical information based on the location of the Company and its subsidiaries
As of and for the year ended March 31, 2009
Yen (millions)
North Other Reconciling Other
Japan America Europe Asia Regions Total Items Adjustments Consolidated
Net sales and other
operating revenue:
External customers ¥1,871,962 ¥4,534,684 ¥1,191,540 ¥1,335,091 ¥1,077,964 ¥10,011,241 ¥ — ¥— ¥10,011,241
Transfers between
geographic areas 2,290,625 244,440 87,362 273,140 66,256 2,961,823 (2,961,823) — —
Total 4,162,587 4,779,124 1,278,902 1,608,231 1,144,220 12,973,064 (2,961,823) — 10,011,241
Cost of sales, SG&A and
R&D expenses 4,324,203 4,699,422 1,268,701 1,504,628 1,009,158 12,806,112 (2,984,514) — 9,821,598
Operating income (loss) ¥ (161,616) ¥ 79,702 ¥ 10,201 ¥ 103,603 ¥ 135,062 ¥ 166,952 ¥ 22,691 ¥— ¥ 189,643
Assets ¥3,078,478 ¥6,547,880 ¥ 766,594 ¥1,016,059 ¥ 450,081 ¥11,859,092 ¥ (40,175) ¥— ¥11,818,917
Long-lived assets 1,140,316 1,918,579 110,543 253,113 119,373 3,541,924 — — 3,541,924
As of and for the year ended March 31, 2010
Yen (millions)
North Other Reconciling Other
Japan America Europe Asia Regions Total Items Adjustments Consolidated
Net sales and other
operating revenue:
External customers ¥1,864,513 ¥3,752,417 ¥769,857 ¥1,320,047 ¥872,340 ¥ 8,579,174 ¥ — ¥— ¥ 8,579,174
Transfers between
geographic areas 1,441,264 155,799 55,615 198,533 24,151 1,875,362 (1,875,362) — —
Total 3,305,777 3,908,216 825,472 1,518,580 896,491 10,454,536 (1,875,362) — 8,579,174
Cost of sales, SG&A and
R&D expenses 3,334,912 3,671,837 836,344 1,405,574 850,683 10,099,350 (1,883,951) — 8,215,399
Operating income (loss) ¥ (29,135) ¥ 236,379 ¥ (10,872) ¥ 113,006 ¥ 45,808 ¥ 355,186 ¥ 8,589 ¥— ¥ 363,775
Assets ¥2,947,764 ¥6,319,896 ¥591,423 ¥1,050,727 ¥619,345 ¥11,529,155 ¥ 99,960 ¥— ¥11,629,115
Long-lived assets 1,113,386 1,861,596 107,262 240,704 162,198 3,485,146 — — 3,485,146
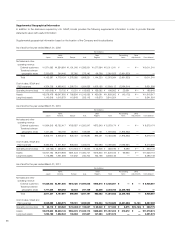
As of and for the year ended March 31, 2011
Yen (millions)
North Other Reconciling Other
Japan America Europe Asia Regions Total Items Adjustments Consolidated
Net sales and other
operating revenue:
External customers ¥1,834,003 ¥3,941,505 ¥618,426 ¥1,594,058 ¥948,875 ¥ 8,936,867 ¥ — ¥ — ¥ 8,936,867
Transfers between
geographic areas 1,777,204 206,392 80,872 247,109 33,208 2,344,785 (2,344,785) — —
Total 3,611,207 4,147,897 699,298 1,841,167 982,083 11,281,652 (2,344,785) — 8,936,867
Cost of sales, SG&A and
R&D expenses 3,545,089 3,846,975 709,501 1,690,530 912,534 10,704,629 (2,351,660) 14,123 8,367,092
Operating income (loss) ¥ 66,118 ¥ 300,922 ¥ (10,203) ¥ 150,637 ¥ 69,549 ¥ 577,023 ¥ 6,875 ¥(14,123) ¥ 569,775
Assets ¥2,875,630 ¥6,209,145 ¥564,678 ¥1,049,113 ¥658,636 ¥11,357,202 ¥ 213,672 ¥ — ¥11,570,874
Long-lived assets 1,053,168 1,852,542 106,633 231,867 147,363 3,391,573 — — 3,391,573
68