Honda 2011 Annual Report Download - page 58
Download and view the complete annual report
Please find page 58 of the 2011 Honda annual report below. You can navigate through the pages in the report by either clicking on the pages listed below, or by using the keyword search tool below to find specific information within the annual report.-
 1
1 -
2
-
3
-
4
-
5
-
6
-
7
-
8
-
9
-
10
-
11
-
12
-
13
-
14
-
15
-
16
-
17
-
18
-
19
-
20
-
21
-
22
-
23
-
24
-
25
-
26
-
27
-
28
-
29
-
30
-
31
-
32
-
33
-
34
-
35
-
36
-
37
-
38
-
39
-
40
-
41
-
42
-
43
-
44
-
45
-
46
-
47
-
 48
48 -
 49
49 -
 50
50 -
 51
51 -
 52
52 -
 53
53 -
 54
54 -
 55
55 -
 56
56 -
 57
57 -
 58
58 -
 59
59 -
 60
60 -
 61
61 -
 62
62 -
 63
63 -
 64
64 -
 65
65 -
 66
66 -
 67
67 -
 68
68 -
69
-
70
-
71
-
72
-
73
-
74
-
75
-
76
-
77
-
78
-
79
-
80
 |
 |

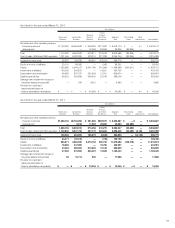
Finance Subsidiaries–Receivables
2010 2011
Yen (millions) Yen (millions)
Expected maturity date Average
Fair Within 1-2 2-3 3-4 4-5 Fair interest
Total value Total 1 year year year year year Thereafter value rate
Direct financing leases
*
1
JP¥ ¥ 29,401
*
¥ 31,329 14,512 8,591 4,819 2,344 1,063 —
*
4.39%
US$ 7,349
*
— — — — — — —
*
—
Other 412,709
*
330,807 116,559 99,741 63,982 48,781 1,744 —
*
2.83%
Total—Direct financing leases ¥ 449,459
*
¥ 362,136 131,071 108,332 68,801 51,125 2,807 —
*
Other finance
subsidiaries–receivables:
JP¥ ¥ 456,525 449,776 ¥ 500,213 160,317 123,363 93,468 61,286 39,444 22,335 505,615 4.39%
US$ 2,504,187 2,536,110 2,554,404 926,042 626,043 476,240 323,853 160,972 41,254 2,588,307 4.81%
Other 617,507 625,523 615,039 283,393 151,909 99,213 55,871 19,209 5,444 607,296 6.50%
Total—Other finance
subsidiaries–receivables: ¥3,578,219 3,611,409 ¥3,669,656 1,369,752 901,315 668,921 441,010 219,625 69,033 3,701,218
Retained interest in securitizations
*
2 27,555 27,555 — —
Total
*
3 ¥4,055,233 ¥4,031,792
*1 Under U.S. generally accepted accounting principles, disclosure of fair values of direct financing leases is not required.
*2 The retained interest in securitizations is accounted for as “trading” securities and is reported at fair value.
*3 The finance subsidiaries–receivables include finance subsidiaries–receivables included in trade accounts and notes receivables and other assets in the consolidated balance sheets.
Long-Term Debt (including current portion)
2010 2011
Yen (millions) Yen (millions)
Expected maturity date Average
Fair Within 1-2 2-3 3-4 4-5 Fair interest
Total value Total 1 year year year year year Thereafter value rate
Japanese yen bonds ¥ 320,000 323,852 ¥ 320,000 70,000 120,000 40,000 30,000 60,000 — 322,270 1.01%
Japanese yen medium-
term notes (Fixed rate) 151,998 153,250 102,226 33,909 25,306 6,502 6,001 27,507 3,001 102,896 1.35%
Japanese yen medium-
term notes (Floating rate) 114,676 114,599 80,619 16,504 58,614 3,501 — 2,000 — 80,770 0.49%
U.S. dollar medium-
term notes (Fixed rate) 391,272 420,970 451,891 28,967 41,381 141,526 45,521 82,764 111,732 477,827 4.38%
U.S. dollar medium-
term notes (Floating rate) 211,685 213,695 297,285 146,160 89,963 10,014 8,276 42,872 — 299,014 0.98%
Asset-backed notes 311,222 316,596 453,802 239,339 148,699 60,403 5,361 — — 458,794 1.94%
Loans and others—primarily
fixed rate 1,534,478 1,582,083 1,299,872 427,576 310,459 313,575 160,431 84,818 3,013 1,322,989 3.31%
Total ¥3,035,331 3,125,045 ¥3,005,695 962,455 794,422 575,521 255,590 299,961 117,746 3,064,560
56