Honda 2011 Annual Report Download - page 30
Download and view the complete annual report
Please find page 30 of the 2011 Honda annual report below. You can navigate through the pages in the report by either clicking on the pages listed below, or by using the keyword search tool below to find specific information within the annual report.-
 1
1 -
2
-
3
-
4
-
5
-
6
-
7
-
8
-
9
-
10
-
11
-
12
-
13
-
14
-
15
-
16
-
17
-
18
-
19
-
 20
20 -
 21
21 -
 22
22 -
 23
23 -
 24
24 -
 25
25 -
 26
26 -
 27
27 -
 28
28 -
 29
29 -
 30
30 -
 31
31 -
 32
32 -
 33
33 -
 34
34 -
 35
35 -
 36
36 -
 37
37 -
 38
38 -
 39
39 -
 40
40 -
41
-
42
-
43
-
44
-
45
-
46
-
47
-
48
-
49
-
50
-
51
-
52
-
53
-
54
-
55
-
56
-
57
-
58
-
59
-
60
-
61
-
62
-
63
-
64
-
65
-
66
-
67
-
68
-
69
-
70
-
71
-
72
-
73
-
74
-
75
-
76
-
77
-
78
-
79
-
80
 |
 |

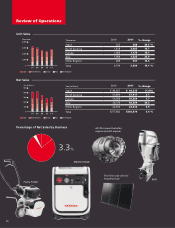
Yen (millions) 2010 2011 % change
Finance Receivables ¥3,461,493 ¥3,479,981 0.5%
Property on Operating Leases 1,308,147 1,357,632 3.8
Total ¥4,769,640 ¥4,837,613 1.4%
Property on
Operating Leases
Finance
Receivables
07 08 09 10 11
Yen (billions)
6,000
4,500
3,000
1,500
0
Yen (millions) 2010 2011 % change
Japan ¥ 24,635 ¥ 26,349 7.0 %
North America 553,169 503,960 (8.9)
Europe 10,428 9,263 (11.2)
Asia 4,318 3,728 (13.7)
Other Regions 13,802 18,596 34.7
Total ¥606,352 ¥561,896 (7.3)%
Japan North America Europe Asia Other Regions
07 08 09 10 11
600
450
300
150
0
Yen (billions)
(千台) (十億円)
(千台)
(千台)
(十億円)
(十億円)
(十億円)(十億円)
日 本 北 米 欧 州 アジア その他の地域 長 期 短 期
6.3%
Net Sales
Finance Receivables and Property on Operating Leases
Percentage of Net Sales by Business
Review of Operations
28