Honda 2011 Annual Report Download - page 22
Download and view the complete annual report
Please find page 22 of the 2011 Honda annual report below. You can navigate through the pages in the report by either clicking on the pages listed below, or by using the keyword search tool below to find specific information within the annual report.-
 1
1 -
2
-
3
-
4
-
5
-
6
-
7
-
8
-
9
-
10
-
11
-
 12
12 -
 13
13 -
 14
14 -
 15
15 -
 16
16 -
 17
17 -
 18
18 -
 19
19 -
 20
20 -
 21
21 -
 22
22 -
 23
23 -
 24
24 -
 25
25 -
 26
26 -
 27
27 -
 28
28 -
 29
29 -
 30
30 -
 31
31 -
 32
32 -
33
-
34
-
35
-
36
-
37
-
38
-
39
-
40
-
41
-
42
-
43
-
44
-
45
-
46
-
47
-
48
-
49
-
50
-
51
-
52
-
53
-
54
-
55
-
56
-
57
-
58
-
59
-
60
-
61
-
62
-
63
-
64
-
65
-
66
-
67
-
68
-
69
-
70
-
71
-
72
-
73
-
74
-
75
-
76
-
77
-
78
-
79
-
80
 |
 |

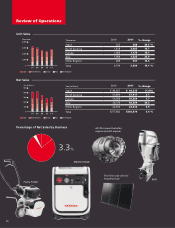
Thousands 2010 2011 % change
Japan 646 582 (9.9)%
North America 1,297 1,458 12.4
Europe 249 198 (20.5)
Asia 950 1,008 6.1
Other Regions 250 266 6.4
Total 3,392 3,512 3.5 %
Yen (millions) 2010 2011 % change
Japan ¥1,383,855 ¥1,310,734 (5.3)%
North America 3,013,432 3,252,852 7.9
Europe 575,326 441,696 (23.2)
Asia 1,041,258 1,221,704 17.3
Other Regions 540,977 567,112 4.8
Total ¥6,554,848 ¥6,794,098 3.6 %
07 08 09 10 11
Thousands
4,000
3,000
2,000
1,000
0
Japan North America Europe Asia Other Regions
Japan North America Europe Asia Other Regions
07 08 09 10 11
Yen (billions)
10,000
7,500
5,000
2,500
0
(千台) (十億円)
(千台)
(千台)
(十億円)
(十億円)
(十億円)(十億円)
日 本 北 米 欧 州 アジア その他の地域 長 期 短 期
76.0%
Unit Sales
Net Sales
Percentage of Net Sales by Business
Review of Operations
20