Honda 2011 Annual Report Download - page 6
Download and view the complete annual report
Please find page 6 of the 2011 Honda annual report below. You can navigate through the pages in the report by either clicking on the pages listed below, or by using the keyword search tool below to find specific information within the annual report.-
 1
1 -
 2
2 -
 3
3 -
 4
4 -
 5
5 -
 6
6 -
 7
7 -
 8
8 -
 9
9 -
 10
10 -
 11
11 -
 12
12 -
 13
13 -
 14
14 -
 15
15 -
 16
16 -
 17
17 -
18
-
19
-
20
-
21
-
22
-
23
-
24
-
25
-
26
-
27
-
28
-
29
-
30
-
31
-
32
-
33
-
34
-
35
-
36
-
37
-
38
-
39
-
40
-
41
-
42
-
43
-
44
-
45
-
46
-
47
-
48
-
49
-
50
-
51
-
52
-
53
-
54
-
55
-
56
-
57
-
58
-
59
-
60
-
61
-
62
-
63
-
64
-
65
-
66
-
67
-
68
-
69
-
70
-
71
-
72
-
73
-
74
-
75
-
76
-
77
-
78
-
79
-
80
 |
 |

Yen
(millions except per share data)
U.S. dollars
(millions except per share data)
2009 2010 2011 2011
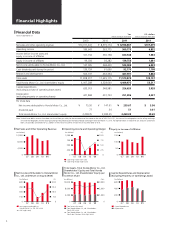
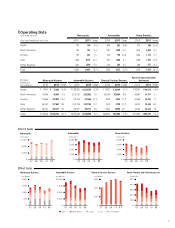
Net sales and other operating revenue ¥10,011,241 ¥ 8,579,174 ¥ 8,936,867 $107,479
Operating income 189,643 363,775 569,775 6,852
Income before income taxes and
equity in income of affiliates 161,734 336,198 630,548 7,583
Equity in income of affiliates 99,034 93,282 139,756 1,681
Net income attributable to Honda Motor Co., Ltd. 137,005 268,400 534,088 6,423
Cash dividends paid during the period 139,724 61,696 92,170 1,108
Research and development 563,197 463,354 487,591 5,864
Total assets 11,818,917 11,629,115 11,570,874 139,157
Total Honda Motor Co., Ltd. shareholders’ equity 4,007,288 4,328,640 4,449,975 53,517
Capital expenditures
(excluding purchase of operating lease assets) 633,913 348,981 326,620 3,928
Depreciation
(excluding property on operating leases) 441,868 401,743 351,496 4,227
Per share data
Net income attributable to Honda Motor Co., Ltd. ¥ 75.50 ¥ 147.91 ¥ 295.67 $ 3.56
Dividends paid 77 34 51 0.61
Total Honda Motor Co., Ltd. shareholders’ equity 2,208.35 2,385.45 2,469.05 29.69
Note: United States dollar amounts have been translated from yen solely for the convenience of the reader at the rate of ¥83.15=U.S.$1, the mean of the telegraphic transfer selling exchange
rate and the telegraphic transfer buying exchange rate prevailing on the Tokyo foreign exchange market on March 31, 2011. No representation is made that yen amounts could have
been, or could be, converted into U.S. dollars at that rate or any other rate on this or any other date or at all.
Financial Data
Years ended March 31
12,000
8,000
4,000
007 08 09 10 11
Yen (billions)
1,000
750
500
250
0
10.0
7.5
5.0
2.5
0
(%)
07 08 09 10 11
Yen (billions)
Operating Income (left scale)
Operating Margin (right scale)
150
100
50
007 08 09 10 11
Yen (billions)
Net Sales and Other Operating Revenue Operating Income and Operating Margin Equity in Income of Affiliates
600
450
300
150
0
(%)
20.0
15.0
10.0
5.0
0
07 08 09 10 11
Yen (billions)
ROE (right scale)
Net Income Attributable to
Honda Motor Co., Ltd. (left scale)
12,000
8,000
4,000
0
3,000
2,000
1,000
0
07 08 09 10 11
Yen (billions) (Yen)
Total Assets (left scale)
Total Honda Motor Co., Ltd. Shareholders’
Equity (left scale)
Total Honda Motor Co., Ltd. Shareholders’
Equity per Common Share (right scale)
600
400
200
007 08 09 10 11
Yen (billions)
Capital Expenditures
Depreciation
Capital Expenditures and Depreciation
(Excluding Property on Operating Leases)
Net Income Attributable to Honda Motor
Co., Ltd. and Return on Equity (ROE)
Total Assets, Total Honda Motor Co., Ltd.
Shareholders’ Equity and Total Honda
Motor Co., Ltd. Shareholders’ Equity per
Common Share
Financial Highlights
4