Honda 2011 Annual Report Download - page 28
Download and view the complete annual report
Please find page 28 of the 2011 Honda annual report below. You can navigate through the pages in the report by either clicking on the pages listed below, or by using the keyword search tool below to find specific information within the annual report.-
 1
1 -
2
-
3
-
4
-
5
-
6
-
7
-
8
-
9
-
10
-
11
-
12
-
13
-
14
-
15
-
16
-
17
-
 18
18 -
 19
19 -
 20
20 -
 21
21 -
 22
22 -
 23
23 -
 24
24 -
 25
25 -
 26
26 -
 27
27 -
 28
28 -
 29
29 -
 30
30 -
 31
31 -
 32
32 -
 33
33 -
 34
34 -
 35
35 -
 36
36 -
 37
37 -
 38
38 -
39
-
40
-
41
-
42
-
43
-
44
-
45
-
46
-
47
-
48
-
49
-
50
-
51
-
52
-
53
-
54
-
55
-
56
-
57
-
58
-
59
-
60
-
61
-
62
-
63
-
64
-
65
-
66
-
67
-
68
-
69
-
70
-
71
-
72
-
73
-
74
-
75
-
76
-
77
-
78
-
79
-
80
 |
 |

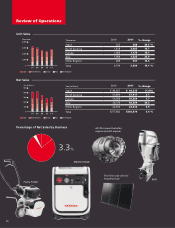
Thousands 2010 2011 % change
Japan 322 388 20.5 %
North America 1,818 2,085 14.7
Europe 1,066 1,174 10.1
Asia 1,069 1,325 23.9
Other Regions 469 537 14.5
Total 4,744 5,509 16.1 %
Yen (millions) 2010 2011 % change
Japan ¥ 98,367 ¥ 96,515 (1.9)%
North America 65,890 67,917 3.1
Europe 54,366 55,264 1.7
Asia 36,754 49,369 34.3
Other Regions 22,305 23,614 5.9
Total ¥277,682 ¥292,679 5.4 %
07 08 09 10 11
Thousands
8,000
6,000
4,000
2,000
0
Japan North America Europe Asia Other Regions
Japan North America Europe Asia Other Regions
07 08 09 10 11
Yen (billions)
500
400
300
200
100
0
BF60
HF120 compact turbofan
engine (aircraft engine)
Thin-film solar cells for
household use
ENEPO EU9iGB
Pianta FV200
(千台) (十億円)
(千台)
(千台)
(十億円)
(十億円)
(十億円)(十億円)
日 本 北 米 欧 州 アジア その他の地域 長 期 短 期
3.3%
Unit Sales
Net Sales
Percentage of Net Sales by Business
Review of Operations
26