Honda 2011 Annual Report Download - page 71
Download and view the complete annual report
Please find page 71 of the 2011 Honda annual report below. You can navigate through the pages in the report by either clicking on the pages listed below, or by using the keyword search tool below to find specific information within the annual report.-
 1
1 -
2
-
3
-
4
-
5
-
6
-
7
-
8
-
9
-
10
-
11
-
12
-
13
-
14
-
15
-
16
-
17
-
18
-
19
-
20
-
21
-
22
-
23
-
24
-
25
-
26
-
27
-
28
-
29
-
30
-
31
-
32
-
33
-
34
-
35
-
36
-
37
-
38
-
39
-
40
-
41
-
42
-
43
-
44
-
45
-
46
-
47
-
48
-
49
-
50
-
51
-
52
-
53
-
54
-
55
-
56
-
57
-
58
-
59
-
60
-
 61
61 -
 62
62 -
 63
63 -
 64
64 -
 65
65 -
 66
66 -
 67
67 -
 68
68 -
 69
69 -
 70
70 -
 71
71 -
 72
72 -
 73
73 -
 74
74 -
 75
75 -
 76
76 -
 77
77 -
 78
78 -
 79
79 -
 80
80
 |
 |

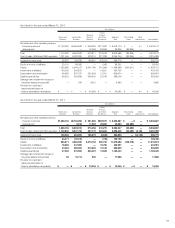
As of and for the year ended March 31, 2011
U.S dollars (millions)
North Other Reconciling Other
Japan America Europe Asia Regions Total Items Adjustments Consolidated
Net sales and other
operating revenue:
External customers $22,057 $47,402 $7,437 $19,171 $11,412 $107,479 $ — $ — $107,479
Transfers between
geographic areas 21,373 2,482 973 2,972 399 28,199 (28,199) — —
Total 43,430 49,884 8,410 22,143 11,811 135,678 (28,199) — 107,479
Cost of sales, SG&A and
R&D expenses 42,635 46,265 8,533 20,331 10,974 128,738 (28,282) 171 100,627
Operating income (loss) $ 795 $ 3,619 $ (123) $ 1,812 $ 837 $ 6,940 $ 83 $(171) $ 6,852
Assets $34,584 $74,674 $6,791 $12,617 $ 7,921 $136,587 $ 2,570 $ — $139,157
Long-lived assets 12,666 22,280 1,282 2,789 1,772 40,789 — — 40,789
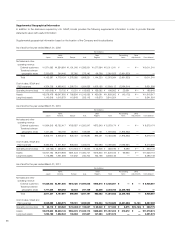
Explanatory notes:
1. Major countries or regions in each geographic area:
North America United States, Canada, Mexico
Europe United Kingdom, Germany, France, Italy, Belgium
Asia Thailand, Indonesia, China, India, Vietnam
Other Regions Brazil, Australia
2. Operating income (loss) of each geographical region is measured in a consistent manner with consolidated operating income, which is
income before income taxes and equity in income of affiliates before other income (expenses), except Other Adjustments, which is out-of-
period adjustments. The adjustments are not included in Japan but as Other Adjustments for the year ended March 31, 2011.
3. Assets of each geographical region are defined as total assets, including derivative financial instruments, investments in affiliates, and
deferred tax assets.
4. Sales and revenues between geographic areas are generally made at values that approximate arm’s-length prices.
5. Unallocated corporate assets, included in reconciling items, amounted to ¥257,291 million as of March 31, 2009, ¥338,135 million as of
March 31, 2010, and ¥453,116 million as of March 31, 2011, which consist primarily of cash and cash equivalents, available-for-sale
securities, and held-to-maturity securities held by the Company. Reconciling items also include elimination of transactions between
geographic areas.
6. Cost of sales, SG&A and R&D expenses of Japan includes ¥45,720 million for the year ended March 31, 2011 related to loss of the Great
East Japan Earthquake.
Basis of Translating Financial Statements
The consolidated financial statements are expressed in Japanese yen. However, the consolidated financial statements as of and for the year
ended March 31, 2011 have been translated into United States dollars at the rate of ¥83.15 = U.S.$1, the approximate exchange rate
prevailing on the Tokyo Foreign Exchange Market on March 31, 2011. Those U.S. dollar amounts presented in the consolidated financial
statements and related notes are included solely for the reader. This translation should not be construed as a representation that all the
amounts shown could be converted into U.S. dollars.
69