Honda 2011 Annual Report Download - page 4
Download and view the complete annual report
Please find page 4 of the 2011 Honda annual report below. You can navigate through the pages in the report by either clicking on the pages listed below, or by using the keyword search tool below to find specific information within the annual report.-
 1
1 -
 2
2 -
 3
3 -
 4
4 -
 5
5 -
 6
6 -
 7
7 -
 8
8 -
 9
9 -
 10
10 -
 11
11 -
 12
12 -
 13
13 -
 14
14 -
 15
15 -
16
-
17
-
18
-
19
-
20
-
21
-
22
-
23
-
24
-
25
-
26
-
27
-
28
-
29
-
30
-
31
-
32
-
33
-
34
-
35
-
36
-
37
-
38
-
39
-
40
-
41
-
42
-
43
-
44
-
45
-
46
-
47
-
48
-
49
-
50
-
51
-
52
-
53
-
54
-
55
-
56
-
57
-
58
-
59
-
60
-
61
-
62
-
63
-
64
-
65
-
66
-
67
-
68
-
69
-
70
-
71
-
72
-
73
-
74
-
75
-
76
-
77
-
78
-
79
-
80
 |
 |
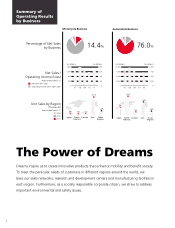
The Power of Dreams
Dreams inspire us to create innovative products that enhance mobility and benefit society.
To meet the particular needs of customers in different regions around the world, we
base our sales networks, research and development centers and manufacturing facilities in
each region. Furthermore, as a socially responsible corporate citizen, we strive to address
important environmental and safety issues.
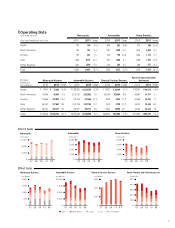
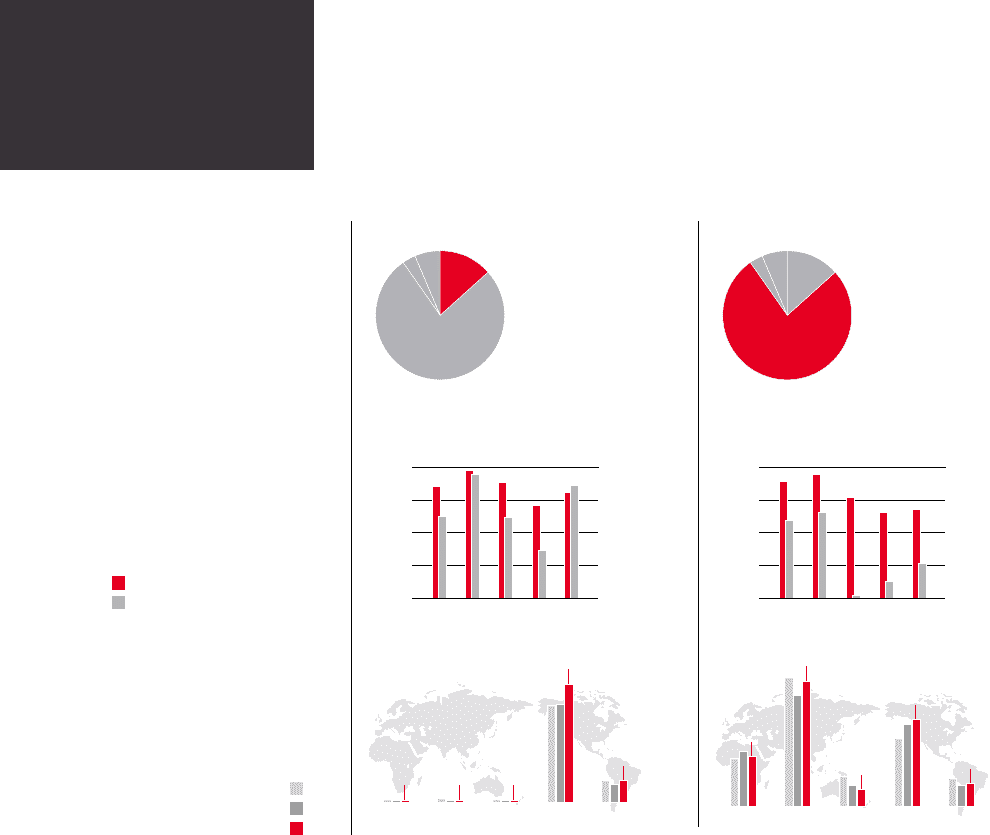
Percentage of Net Sales
by Business
Summary of
Operating Results
by Business
Yen (billions)Yen (billions)
1,600
1,200
800
400
007 08 09 10 11
160
120
80
40
0
Japan AsiaEurope Other
Regions
North
America
190 185 202
9,178
1,690
07 08 09 10 11
Yen (billions)Yen (billions)
10,000
7,500
5,000
2,500
0
1,000
750
500
250
0
Japan AsiaEurope Other
Regions
North
America
582
198
1,458
1,008
266
14.4%76.0%
Net Sales /
Operating Income (Loss)
Years ended March 31
Net Sales (left scale)
Operating Income (Loss) (right scale)
2010
2011
2009
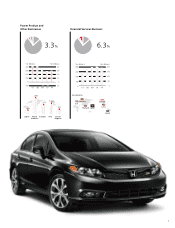
Motorcycle Business Automobile Business
Unit Sales by Region
(Thousands)
Years ended March 31
2