Honda 2011 Annual Report Download - page 16
Download and view the complete annual report
Please find page 16 of the 2011 Honda annual report below. You can navigate through the pages in the report by either clicking on the pages listed below, or by using the keyword search tool below to find specific information within the annual report.-
 1
1 -
2
-
3
-
4
-
5
-
 6
6 -
 7
7 -
 8
8 -
 9
9 -
 10
10 -
 11
11 -
 12
12 -
 13
13 -
 14
14 -
 15
15 -
 16
16 -
 17
17 -
 18
18 -
 19
19 -
 20
20 -
 21
21 -
 22
22 -
 23
23 -
 24
24 -
 25
25 -
 26
26 -
27
-
28
-
29
-
30
-
31
-
32
-
33
-
34
-
35
-
36
-
37
-
38
-
39
-
40
-
41
-
42
-
43
-
44
-
45
-
46
-
47
-
48
-
49
-
50
-
51
-
52
-
53
-
54
-
55
-
56
-
57
-
58
-
59
-
60
-
61
-
62
-
63
-
64
-
65
-
66
-
67
-
68
-
69
-
70
-
71
-
72
-
73
-
74
-
75
-
76
-
77
-
78
-
79
-
80
 |
 |

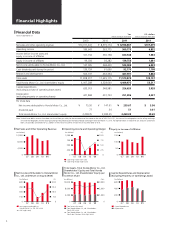
Thousands 2010 2011 % change
Japan 190 190 0.0 %
North America 189 185 (2.1)
Europe 199 202 1.5
Asia 7,628 9,178 20.3
Other Regions 1,433 1,690 17.9
Total 9,639 11,445 18.7 %
Yen (millions) 2010 2011 % change
Japan ¥ 70,461 ¥ 70,244 (0.3)%
North America 103,956 96,664 (7.0)
Europe 124,665 103,890 (16.7)
Asia 461,067 577,669 25.3
Other Regions 380,143 439,727 15.7
Total ¥1,140,292 ¥1,288,194 13.0 %
Unit Sales
Net Sales
Thousands
12,000
8,000
4,000
0
07 08 09 10 11
Japan North America Europe Asia Other Regions
Japan North America Europe Asia Other Regions
Yen (billions)
07 08 09 10 11
2,000
1,500
1,000
500
0
Percentage of Net Sales by Business
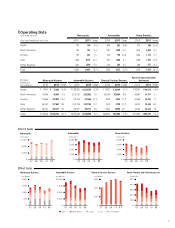
(千台) (十億円)
(千台)
(千台)
(十億円)
(十億円)
(十億円)(十億円)
日 本 北 米 欧 州 アジア その他の地域 長 期 短 期
14.4%
CBR250R (Japan)
Review of Operations
14