Honda 2011 Annual Report Download - page 69
Download and view the complete annual report
Please find page 69 of the 2011 Honda annual report below. You can navigate through the pages in the report by either clicking on the pages listed below, or by using the keyword search tool below to find specific information within the annual report.-
 1
1 -
2
-
3
-
4
-
5
-
6
-
7
-
8
-
9
-
10
-
11
-
12
-
13
-
14
-
15
-
16
-
17
-
18
-
19
-
20
-
21
-
22
-
23
-
24
-
25
-
26
-
27
-
28
-
29
-
30
-
31
-
32
-
33
-
34
-
35
-
36
-
37
-
38
-
39
-
40
-
41
-
42
-
43
-
44
-
45
-
46
-
47
-
48
-
49
-
50
-
51
-
52
-
53
-
54
-
55
-
56
-
57
-
58
-
 59
59 -
 60
60 -
 61
61 -
 62
62 -
 63
63 -
 64
64 -
 65
65 -
 66
66 -
 67
67 -
 68
68 -
 69
69 -
 70
70 -
 71
71 -
 72
72 -
 73
73 -
 74
74 -
 75
75 -
 76
76 -
 77
77 -
 78
78 -
 79
79 -
80
 |
 |

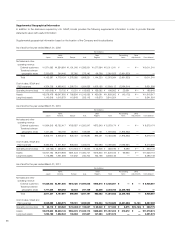
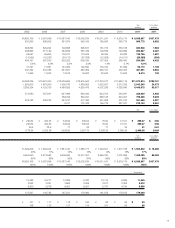
Geographical Information
As of and for the year ended March 31, 2009
Yen (millions)
Japan United States Other Countries Total
Sales to external customers ¥1,871,962 ¥3,990,729 ¥4,148,550 ¥10,011,241
Long-lived assets 1,140,316 1,835,163 566,445 3,541,924
As of and for the year ended March 31, 2010
Yen (millions)
Japan United States Other Countries Total
Sales to external customers ¥1,864,513 ¥3,294,758 ¥3,419,903 ¥8,579,174
Long-lived assets 1,113,386 1,767,879 603,881 3,485,146
As of and for the year ended March 31, 2011
Yen (millions)
Japan United States Other Countries Total
Sales to external customers ¥1,834,003 ¥3,504,765 ¥3,598,099 ¥8,936,867
Long-lived assets 1,053,168 1,766,814 571,591 3,391,573
As of and for the year ended March 31, 2011
U.S. dollars (millions)
Japan United States Other Countries Total
Sales to external customers $22,057 $42,150 $43,272 $107,479
Long-lived assets 12,666 21,249 6,874 40,789
The above information is based on the location of the Company and its subsidiaries.
67