Honda 2011 Annual Report Download - page 7
Download and view the complete annual report
Please find page 7 of the 2011 Honda annual report below. You can navigate through the pages in the report by either clicking on the pages listed below, or by using the keyword search tool below to find specific information within the annual report.-
 1
1 -
 2
2 -
 3
3 -
 4
4 -
 5
5 -
 6
6 -
 7
7 -
 8
8 -
 9
9 -
 10
10 -
 11
11 -
 12
12 -
 13
13 -
 14
14 -
 15
15 -
 16
16 -
 17
17 -
 18
18 -
19
-
20
-
21
-
22
-
23
-
24
-
25
-
26
-
27
-
28
-
29
-
30
-
31
-
32
-
33
-
34
-
35
-
36
-
37
-
38
-
39
-
40
-
41
-
42
-
43
-
44
-
45
-
46
-
47
-
48
-
49
-
50
-
51
-
52
-
53
-
54
-
55
-
56
-
57
-
58
-
59
-
60
-
61
-
62
-
63
-
64
-
65
-
66
-
67
-
68
-
69
-
70
-
71
-
72
-
73
-
74
-
75
-
76
-
77
-
78
-
79
-
80
 |
 |

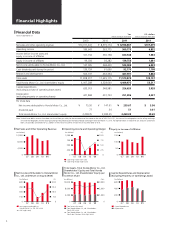
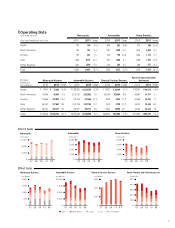
Unit Sales Breakdown (Thousands)
Motorcycles Automobiles Power Products
2010 2011
Change
2010 2011
Change
2010 2011
Change
Japan
190 190 0.0 %646 582 (9.9)%322 388 20.5%
North America
189 185 (2.1) 1,297 1,458 12.4 1,818 2,085 14.7
Europe
199 202 1.5 249 198 (20.5) 1,066 1,174 10.1
Asia
7,628 9,178 20.3 950 1,008 6.1 1,069 1,325 23.9
Other Regions
1,433 1,690 17.9 250 266 6.4 469 537 14.5
Total
9,639 11,445 18.7 %3,392 3,512 3.5 %4,744 5,509 16.1%
Net Sales
Breakdown
Yen (millions)
Motorcycle Business Automobile Business Financial Services Business
Power Product and Other
Businesses
2010 2011
Change
2010 2011
Change
2010 2011
Change
2010 2011
Change
Japan
¥ 70,461 ¥ 70,244 (0.3)%¥1,383,855 ¥1,310,734 (5.3)%¥ 24,635 ¥ 26,349 7.0 %¥ 98,367 ¥ 96,515 (1.9)%
North America
103,956 96,664 (7.0) 3,013,432 3,252,852 7.9 553,169 503,960 (8.9) 65,890 67,917 3.1
Europe
124,665 103,890 (16.7) 575,326 441,696 (23.2) 10,428 9,263 (11.2) 54,366 55,264 1.7
Asia
461,067 577,669 25.3 1,041,258 1,221,704 17.3 4,318 3,728 (13.7) 36,754 49,369 34.3
Other Regions
380,143 439,727 15.7 540,977 567,112 4.8 13,802 18,596 34.7 22,305 23,614 5.9
Total
¥1,140,292 ¥1,288,194 13.0 %¥6,554,848 ¥6,794,098 3.6 %¥606,352 ¥561,896 (7.3)%¥277,682 ¥292,679 5.4 %
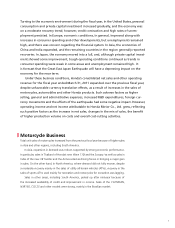
Operating Data
Years ended March 31
Unit Sales
07 08 09 10 11
12,000
8,000
4,000
0
(Thousands)
07 08 09 10 11
4,000
3,000
2,000
1,000
0
(Thousands)
07 08 09 10 11
8,000
6,000
4,000
2,000
0
(Thousands)
Motorcycles Automobiles Power Products
Motorcycle Business Automobile Business Financial Services Business Power Product and Other Businesses
Japan North America Europe Asia Other Regions
07 08 09 10 11
2,000
1,500
1,000
500
0
Yen (billions)
07 08 09 10 11
10,000
7,500
5,000
2,500
0
Yen (billions)
07 08 09 10 11
600
400
200
0
Yen (billions)
07 08 09 10 11
500
400
300
200
100
0
Yen (billions)
Net Sales
5