Honda 2011 Annual Report Download - page 68
Download and view the complete annual report
Please find page 68 of the 2011 Honda annual report below. You can navigate through the pages in the report by either clicking on the pages listed below, or by using the keyword search tool below to find specific information within the annual report.-
 1
1 -
2
-
3
-
4
-
5
-
6
-
7
-
8
-
9
-
10
-
11
-
12
-
13
-
14
-
15
-
16
-
17
-
18
-
19
-
20
-
21
-
22
-
23
-
24
-
25
-
26
-
27
-
28
-
29
-
30
-
31
-
32
-
33
-
34
-
35
-
36
-
37
-
38
-
39
-
40
-
41
-
42
-
43
-
44
-
45
-
46
-
47
-
48
-
49
-
50
-
51
-
52
-
53
-
54
-
55
-
56
-
57
-
 58
58 -
 59
59 -
 60
60 -
 61
61 -
 62
62 -
 63
63 -
 64
64 -
 65
65 -
 66
66 -
 67
67 -
 68
68 -
 69
69 -
 70
70 -
 71
71 -
 72
72 -
 73
73 -
 74
74 -
 75
75 -
 76
76 -
 77
77 -
 78
78 -
79
-
80
 |
 |

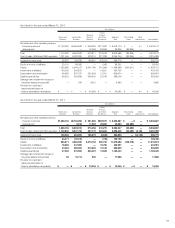
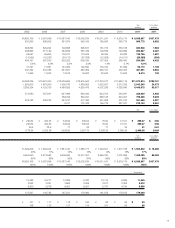
As of and for the year ended March 31, 2011
U.S. dollars (millions)
Power
Financial Product
Motorcycle Automobile Services and Other Segment Reconciling Other
Business Business Business Businesses Total Items Adjustments Consolidated
Net sales and other operating revenue:
External customers $15,492 $81,709 $ 6,758 $3,520 $107,479 $ — $ — $107,479
Intersegment — 99 139 308 546 (546) — —
Total 15,492 81,807 6,896 3,830 108,025 (546) — 107,479
Cost of sales, SG&A and R&D expenses 13,826 78,626 4,656 3,894 101,002 (546) 170 100,627
Segment income (loss) 1,667 3,182 2,240 (67) 7,022 — (170) 6,852
Equity in income of affiliates 487 1,203 — (9) 1,681 — — 1,681
Assets 11,229 58,726 67,013 3,496 140,464 (1,307) — 139,157
Investments in affiliates 917 4,113 — 201 5,231 — — 5,231
Depreciation and amortization 485 3,564 2,571 159 6,779 — — 6,779
Capital expenditures 446 3,289 9,627 168 13,530 — — 13,530
Damaged and impairment loss on
long-lived assets and goodwill 1 202 10 — 212 — — 212
Provision for credit and
lease residual losses on
finance subsidiaries–receivables $ — $ — $ 160 $ — $ 160 $ — $ — $ 160
Explanatory notes:
1. Segment income (loss) of each segment is measured in a consistent manner with consolidated operating income, which is income before
income taxes and equity in income of affiliates before other income (expenses), except Other Adjustments, which is out-of-period adjustments.
Expenses not directly associated with specific segments are allocated based on the most reasonable measures applicable. The amount of
out-of-period adjustments are not reported to or used by the chief operating decision maker in deciding how to allocate resources and in
assessing the Company’s operating performance. Therefore, the adjustments are not included in the Power product and other businesses
but as Other Adjustments for the year ended March 31, 2011.
2. Assets of each segment are defined as total assets, including derivative financial instruments, investments in affiliates, and deferred tax
assets. Segment assets are based on those directly associated with each segment and those not directly associated with specific segments
are allocated based on the most reasonable measures applicable except for the corporate assets described below.
3. Intersegment sales and revenues are generally made at values that approximate arm’s-length prices.
4. Unallocated corporate assets, included in reconciling items, amounted to ¥257,291 million as of March 31, 2009, ¥338,135 million as of
March 31, 2010, and ¥453,116 million as of March 31, 2011, which consist primarily of cash and cash equivalents and available-for-sale
securities and held-to-maturity securities held by the Company. Reconciling items also include elimination of intersegment transactions.
5. Depreciation and amortization of the Financial Services Business include ¥195,776 million for the year ended March 31, 2009, ¥227,931
million for the year ended March 31, 2010 and ¥212,143 million for the year ended March 31, 2011, respectively, of depreciation of property
on operating leases.
6. Capital expenditures of the Financial Services Business includes ¥668,128 million for the year ended March 31, 2009, ¥544,027 million for the
year ended March 31, 2010 and ¥798,420 million for the year ended March 31, 2011, respectively, related to purchases of operating lease
assets.
7. For the year ended March 31, 2011, substantially all of the ¥45,720 million of the costs and expenses resulting from the Great East Japan
Earthquake are included in Cost of sales, SG&A and R&D expenses of the Automobile business.
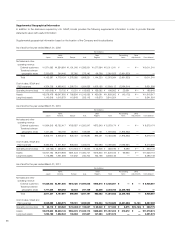
External Sales and Other Operating Revenue by Product or Service Groups
Yen U.S. dollars
(millions) (millions)
Years ended March 31: 2009 2010 2011 2011
Motorcycles and relevant parts ¥ 1,323,259 ¥1,079,165 ¥1,225,098 $ 14,734
All-terrain vehicles (ATVs) and relevant parts 88,252 61,127 63,096 759
Automobiles and relevant parts 7,674,404 6,554,848 6,794,098 81,709
Financial, insurance services 582,261 606,352 561,896 6,758
Power products and relevant parts 224,648 188,014 202,838 2,439
Others 118,417 89,668 89,841 1,080
Total ¥10,011,241 ¥8,579,174 ¥8,936,867 $107,479
66