Honda 2011 Annual Report Download - page 66
Download and view the complete annual report
Please find page 66 of the 2011 Honda annual report below. You can navigate through the pages in the report by either clicking on the pages listed below, or by using the keyword search tool below to find specific information within the annual report.-
 1
1 -
2
-
3
-
4
-
5
-
6
-
7
-
8
-
9
-
10
-
11
-
12
-
13
-
14
-
15
-
16
-
17
-
18
-
19
-
20
-
21
-
22
-
23
-
24
-
25
-
26
-
27
-
28
-
29
-
30
-
31
-
32
-
33
-
34
-
35
-
36
-
37
-
38
-
39
-
40
-
41
-
42
-
43
-
44
-
45
-
46
-
47
-
48
-
49
-
50
-
51
-
52
-
53
-
54
-
55
-
 56
56 -
 57
57 -
 58
58 -
 59
59 -
 60
60 -
 61
61 -
 62
62 -
 63
63 -
 64
64 -
 65
65 -
 66
66 -
 67
67 -
 68
68 -
 69
69 -
 70
70 -
 71
71 -
 72
72 -
 73
73 -
 74
74 -
 75
75 -
 76
76 -
77
-
78
-
79
-
80
 |
 |

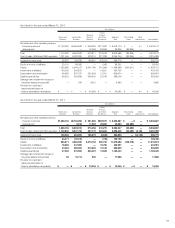
Segment Information
Honda has four reportable segments: the Motorcycle business, the
Automobile business, the Financial services business and the Power
product and other businesses, which are based on Honda’s
organizational structure and characteristics of products and services.
Operating segments are defined as components of Honda’s about
Principal products and services, and functions of each segment are as follows:
Segment Principal products and services Functions
Motorcycle business Motorcycles, all-terrain vehicles (ATVs), Research & Development
and relevant parts Manufacturing
Sales and related services
Automobile business Automobiles and relevant parts Research & Development
Manufacturing
Sales and related services
Financial services business Financial, insurance services Retail loan and lease related to Honda products
Others
Power product and Power products and relevant Research & Development
other businesses parts, and others Manufacturing
Sales and related services
Others
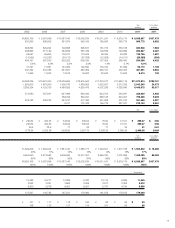
Segment Information
As of and for the year ended March 31, 2009
Yen (millions)
Power
Financial Product
Motorcycle Automobile Services and Other Segment Reconciling Other
Business Business Business Businesses Total Items Adjustments Consolidated
Net sales and other operating revenue:
External customers ¥1,411,511 ¥7,674,404 ¥ 582,261 ¥343,065 ¥10,011,241 ¥ — ¥— ¥10,011,241
Intersegment — — 14,264 25,840 40,104 (40,104) — —
Total 1,411,511 7,674,404 596,525 368,905 10,051,345 (40,104) — 10,011,241
Cost of sales, SG&A and R&D expenses 1,311,598 7,649,861 515,854 384,389 9,861,702 (40,104) — 9,821,598
Segment income (loss) 99,913 24,543 80,671 (15,484) 189,643 — — 189,643
Equity in income of affiliates 26,105 71,709 — 1,220 99,034 — — 99,034
Assets 1,047,112 5,219,408 5,735,716 275,607 12,277,843 (458,926) — 11,818,917
Investments in affiliates 107,431 379,068 — 16,247 502,746 — — 502,746
Depreciation and amortization 51,200 373,295 199,324 13,825 637,644 — — 637,644
Capital expenditures 90,401 523,593 671,127 16,920 1,302,041 — — 1,302,041
Damaged and impairment losses on
long-lived assets and goodwill 413 18,874 18,528 2,310 40,125 — — 40,125
Provision for credit and
lease residual losses on
finance subsidiaries–receivables ¥ — ¥ — ¥ 77,016 ¥ — ¥ 77,016 ¥ — ¥— ¥ 77,016
which separate financial information is available that is evaluated
regularly by the chief operating decision maker in deciding how to
allocate resources and in assessing performance. The accounting
policies used for these reportable segments are consistent with the
accounting policies used in Honda’s consolidated financial
statements.
64