Honda 2011 Annual Report Download - page 65
Download and view the complete annual report
Please find page 65 of the 2011 Honda annual report below. You can navigate through the pages in the report by either clicking on the pages listed below, or by using the keyword search tool below to find specific information within the annual report.-
 1
1 -
2
-
3
-
4
-
5
-
6
-
7
-
8
-
9
-
10
-
11
-
12
-
13
-
14
-
15
-
16
-
17
-
18
-
19
-
20
-
21
-
22
-
23
-
24
-
25
-
26
-
27
-
28
-
29
-
30
-
31
-
32
-
33
-
34
-
35
-
36
-
37
-
38
-
39
-
40
-
41
-
42
-
43
-
44
-
45
-
46
-
47
-
48
-
49
-
50
-
51
-
52
-
53
-
54
-
 55
55 -
 56
56 -
 57
57 -
 58
58 -
 59
59 -
 60
60 -
 61
61 -
 62
62 -
 63
63 -
 64
64 -
 65
65 -
 66
66 -
 67
67 -
 68
68 -
 69
69 -
 70
70 -
 71
71 -
 72
72 -
 73
73 -
 74
74 -
 75
75 -
76
-
77
-
78
-
79
-
80
 |
 |

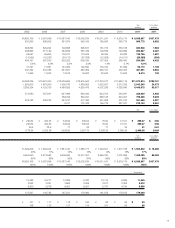
Years ended March 31, 2009, 2010 and 2011
Yen U.S. dollars
(millions) (millions)
2009 2010 2011 2011
Cash flows from operating activities:
Net income ¥ 150,933 ¥ 282,611 ¥ 563,477 $ 6,777
Adjustments to reconcile net income to net cash provided by operating activities:
Depreciation excluding property on operating leases 441,868 401,743 351,496 4,227
Depreciation of property on operating leases 195,776 227,931 212,143 2,551
Deferred income taxes 41,773 56,606 130,180 1,566
Equity in income of affiliates (99,034) (93,282) (139,756) (1,681)
Dividends from affiliates 65,140 140,901 98,182 1,181
Gain on sales of investments in affiliates — — (46,756) (562)
Provision for credit and lease residual losses on finance subsidiaries–receivables 77,016 40,062 13,305 160
Impairment loss on investments in securities 26,001 603 2,133 26
Damaged and impairment loss on long-lived assets and goodwill excluding
property on operating leases 21,597 548 16,833 202
Impairment loss on property on operating leases 18,528 3,312 835 10
Loss (gain) on derivative instruments, net (15,506) (37,753) (7,788) (94)
Decrease (increase) in assets:
Trade accounts and notes receivable (30,025) (6,910) 38,700 465
Inventories (262,782) 352,994 (33,676) (405)
Other current assets (82,838) 103,071 266 3
Other assets 8,640 24,150 (40,729) (490)
Increase (decrease) in liabilities:
Trade accounts and notes payable (133,662) 151,345 (55,331) (665)
Accrued expenses (102,711) (20,457) 39,103 470
Income taxes payable (12,861) (14,524) 9,461 114
Other current liabilities 10,630 5,662 32,209 387
Other liabilities 74,872 (30,146) (83,115) (1,000)
Other, net (9,714) (44,255) (30,335) (364)
Net cash provided by operating activities 383,641 1,544,212 1,070,837 12,878
Cash flows from investing activities:
Increase in investments and advances (4,879) (19,419) (11,412) (137)
Decrease in investments and advances 1,921 14,078 13,995 168
Payments for purchases of available-for-sale securities (31,936) (5,871) (262) (3)
Proceeds from sales of available-for-sale securities 26,896 4,945 2,739 33
Payments for purchases of held-to-maturity securities (17,348) (21,181) (179,951) (2,164)
Proceeds from redemptions of held-to-maturity securities 32,667 6,283 154,977 1,864
Proceeds from sales of investments in affiliates — — 71,073 855
Capital expenditures (635,190) (392,062) (318,543) (3,831)
Proceeds from sales of property, plant and equipment 18,843 24,472 24,725 297
Acquisitions of finance subsidiaries–receivables (2,303,930) (1,448,146) (2,208,480) (26,561)
Collections of finance subsidiaries–receivables 2,023,031 1,595,235 2,109,904 25,375
Sales (repurchases) of finance subsidiaries–receivables, net 324,672 (55,168) — —
Purchases of operating lease assets (668,128) (544,027) (798,420) (9,602)
Proceeds from sales of operating lease assets 100,017 245,110 408,265 4,910
Net cash used in investing activities (1,133,364) (595,751) (731,390) (8,796)
Cash flows from financing activities:
Increase (decrease) in short-term debt, net 270,795 (649,641) 113,669 1,367
Proceeds from long-term debt 1,299,984 1,132,222 799,520 9,615
Repayments of long-term debt (889,483) (963,833) (870,406) (10,469)
Dividends paid (139,724) (61,696) (92,170) (1,108)
Dividends paid to noncontrolling interests (10,841) (16,278) (16,232) (195)
Sales (purchases) of treasury stock, net 131 (18) (34,797) (418)
Net cash provided by (used in) financing activities 530,862 (559,244) (100,416) (1,208)
Effect of exchange rate changes on cash and cash equivalents (141,672) 40,316 (79,909) (960)
Net change in cash and cash equivalents (360,533) 429,533 159,122 1,914
Cash and cash equivalents at beginning of year 1,050,902 690,369 1,119,902 13,468
Cash and cash equivalents at end of year ¥ 690,369 ¥1,119,902 ¥1,279,024 $15,382
63
Consolidated Statements of Cash Flows