Home Depot 2005 Annual Report Download - page 80
Download and view the complete annual report
Please find page 80 of the 2005 Home Depot annual report below. You can navigate through the pages in the report by either clicking on the pages listed below, or by using the keyword search tool below to find specific information within the annual report.-
 1
1 -
2
-
3
-
4
-
5
-
6
-
7
-
8
-
9
-
10
-
11
-
12
-
13
-
14
-
15
-
16
-
17
-
18
-
19
-
20
-
21
-
22
-
23
-
24
-
25
-
26
-
27
-
28
-
29
-
30
-
31
-
32
-
33
-
34
-
35
-
36
-
37
-
38
-
39
-
40
-
41
-
42
-
43
-
44
-
45
-
46
-
47
-
48
-
49
-
50
-
51
-
52
-
53
-
54
-
55
-
56
-
57
-
58
-
59
-
60
-
61
-
62
-
63
-
64
-
65
-
66
-
67
-
68
-
69
-
 70
70 -
 71
71 -
 72
72 -
 73
73 -
 74
74 -
 75
75 -
 76
76 -
 77
77 -
 78
78 -
 79
79 -
 80
80 -
 81
81 -
 82
82 -
 83
83 -
 84
84
 |
 |

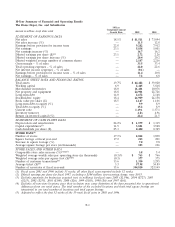
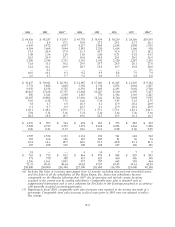
10-Year Summary of Financial and Operating Results
The Home Depot, Inc. and Subsidiaries 10-Year
Compound Annual
amounts in millions, except where noted Growth Rate 2005 2004
STATEMENT OF EARNINGS DATA
Net sales 18.1% $ 81,511 $ 73,094
Net sales increase (%) — 11.5 12.8
Earnings before provision for income taxes 22.8 9,282 7,912
Net earnings 23.1 5,838 5,001
Net earnings increase (%) — 16.7 16.2
Diluted earnings per share ($)(2) 23.1 2.72 2.26
Diluted earnings per share increase (%) — 20.4 20.2
Diluted weighted average number of common shares — 2,147 2,216
Gross margin – % of sales — 33.5 33.4
Total operating expenses – % of sales — 22.0 22.6
Net interest income (expense) – % of sales — (0.1) —
Earnings before provision for income taxes – % of sales — 11.4 10.8
Net earnings – % of sales — 7.2 6.8
BALANCE SHEET DATA AND FINANCIAL RATIOS
Total assets 19.7% $ 44,482 $ 39,020
Working capital 6.9 2,445 3,818
Merchandise inventories 18.0 11,401 10,076
Net property and equipment 18.8 24,901 22,726
Long-term debt 14.0 2,672 2,148
Stockholders’ equity 18.4 26,909 24,158
Book value per share ($) 18.5 12.67 11.06
Long-term debt-to-equity (%) — 9.9 8.9
Total debt-to-equity (%) — 15.2 8.9
Current ratio — 1.19:1 1.37:1
Inventory turnover — 4.8x 4.9x
Return on invested capital (%) — 22.4 21.5
STATEMENT OF CASH FLOWS DATA
Depreciation and amortization 24.2% $ 1,579 $ 1,319
Capital expenditures(3) 11.5 3,881 3,948
Cash dividends per share ($) 25.3 0.400 0.325
STORE DATA(4)
Number of stores 17.1% 2,042 1,890
Square footage at fiscal year-end 17.2 215 201
Increase in square footage (%) — 7.0 9.8
Average square footage per store (in thousands) — 105 106
STORE SALES AND OTHER DATA
Comparable store sales increase (%)(5)(6)(7) —3.8 5.4
Weighted average weekly sales per operating store (in thousands) (0.3)% $ 763 $ 766
Weighted average sales per square foot ($)(4)(5) (0.3) 377 375
Number of customer transactions(4) 13.6 1,330 1,295
Average ticket ($)(4) 3.3 57.98 54.89
Number of associates at fiscal year-end 15.6 344,810 323,149
(1) Fiscal years 2001 and 1996 include 53 weeks; all other fiscal years reported include 52 weeks.
(2) Diluted earnings per share for fiscal 1997, excluding a $104 million non-recurring charge, were $0.55.
(3) Excludes payments for businesses acquired (net, in millions) for fiscal years 2005 ($2,546), 2004 ($727), 2003
($215), 2002 ($235), 2001 ($190), 2000 ($26), 1999 ($101), 1998 ($6) and 1997 ($61).
(4) Excludes all non-store locations since their inclusion may cause distortion of the data presented due to operational
differences from our retail stores. The total number of the excluded locations and their total square footage are
immaterial to our total number of locations and total square footage.
(5) Adjusted to reflect the first 52 weeks of the 53-week fiscal years in 2001 and 1996.
F-1