Home Depot 2005 Annual Report Download - page 38
Download and view the complete annual report
Please find page 38 of the 2005 Home Depot annual report below. You can navigate through the pages in the report by either clicking on the pages listed below, or by using the keyword search tool below to find specific information within the annual report.-
 1
1 -
2
-
3
-
4
-
5
-
6
-
7
-
8
-
9
-
10
-
11
-
12
-
13
-
14
-
15
-
16
-
17
-
18
-
19
-
20
-
21
-
22
-
23
-
24
-
25
-
26
-
27
-
 28
28 -
 29
29 -
 30
30 -
 31
31 -
 32
32 -
 33
33 -
 34
34 -
 35
35 -
 36
36 -
 37
37 -
 38
38 -
 39
39 -
 40
40 -
 41
41 -
 42
42 -
 43
43 -
 44
44 -
 45
45 -
 46
46 -
 47
47 -
 48
48 -
49
-
50
-
51
-
52
-
53
-
54
-
55
-
56
-
57
-
58
-
59
-
60
-
61
-
62
-
63
-
64
-
65
-
66
-
67
-
68
-
69
-
70
-
71
-
72
-
73
-
74
-
75
-
76
-
77
-
78
-
79
-
80
-
81
-
82
-
83
-
84
 |
 |
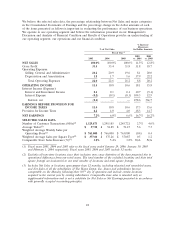
Gross Profit
Gross Profit increased 18.7% to $24.4 billion for fiscal 2004 from $20.6 billion for fiscal 2003, an
increase of 167 basis points. Gross Profit as a percent of Net Sales was 33.4% for fiscal 2004, compared
to 31.8% for fiscal 2003. The adoption of Emerging Issues Task Force 02-16, ‘‘Accounting by a
Customer (Including a Reseller) for Certain Consideration Received from a Vendor’’ (‘‘EITF 02-16’’),
reduced our Cost of Sales by co-op advertising allowances of $891 million, or 122 basis points, in fiscal
2004 and $40 million, or 6 basis points, in fiscal 2003. See section ‘‘Impact of the Adoption of
EITF 02-16.’’ Excluding the impact of the adoption of EITF 02-16, our Gross Profit as a percent of
Net Sales would have been 32.2% for fiscal 2004 compared with 31.7% for fiscal 2003. Improved
inventory management, which resulted in lower shrink levels, contributed 18 basis points of our increase
in Gross Profit. Finally, 33 basis points resulted from benefits arising from a change in merchandising
mix, offset by the cost of our deferred interest programs.
Operating Expenses
Operating Expenses increased 20.2% to $16.5 billion for fiscal 2004 from $13.7 billion for fiscal 2003.
Operating Expenses as a percent of Net Sales were 22.6% for fiscal 2004 compared to 21.2% for fiscal
2003.
SG&A increased 20.0% to $15.3 billion for fiscal 2004 from $12.7 billion for fiscal 2003. As a percent
of Net Sales, SG&A was 20.9% for fiscal 2004 compared to 19.6% for fiscal 2003. The increase in
SG&A in fiscal 2004 includes $1.0 billion of advertising expense related to the adoption of EITF 02-16.
Excluding the impact of EITF 02-16, SG&A increased 12.2% to $14.3 billion, or 19.5% of Net Sales, in
fiscal 2004 compared with 19.6% of Net Sales in fiscal 2003. The decrease in SG&A as a percent of
Net Sales for fiscal 2004, excluding the impact of EITF 02-16, was due to an increase in labor
productivity and benefits from our private label credit card, which carries a lower discount rate than
other forms of credit, like bank cards. Labor productivity, as measured by sales per labor hour, reached
an all-time high in fiscal 2004, as we moved our associates from tasking to selling activities. This
reduction in costs was partially offset by higher expenses associated with incentive programs, like our
success sharing program and our management incentive plan and stock-based compensation expense. In
addition, our planned investment in store modernization and technology caused remodel and repair
expenses to rise at a faster rate than our Net Sales growth.
Depreciation and Amortization increased 22.2% to $1.2 billion for fiscal 2004 from $1.0 billion for
fiscal 2003. Depreciation and Amortization as a percent of Net Sales was 1.7% for fiscal 2004 and 1.6%
for fiscal 2003. The increase in fiscal 2004 was primarily due to our investment in store modernization
and technology.
Interest, net
In fiscal 2004, we recognized $14 million of net Interest Expense compared to $3 million in fiscal 2003.
Net Interest Expense as a percent of Net Sales was less than 0.1% for both fiscal 2004 and fiscal 2003.
Interest Expense increased 12.9% to $70 million for fiscal 2004 from $62 million for fiscal 2003
primarily due to an increase in outstanding indebtedness and a reduction in the amount of capitalized
interest. Interest Expense also increased due to the addition of $38 million in capital leases during the
year. Interest and Investment Income decreased 5.1% to $56 million for fiscal 2004 from $59 million
for fiscal 2003 primarily due to a lower interest rate environment.
Provision for Income Taxes
Our combined federal and state effective income tax rate decreased to 36.8% for fiscal 2004 from
37.1% for fiscal 2003. The majority of this reduction was due to the reversal of a $31 million valuation
26