Home Depot 2005 Annual Report Download - page 36
Download and view the complete annual report
Please find page 36 of the 2005 Home Depot annual report below. You can navigate through the pages in the report by either clicking on the pages listed below, or by using the keyword search tool below to find specific information within the annual report.-
 1
1 -
2
-
3
-
4
-
5
-
6
-
7
-
8
-
9
-
10
-
11
-
12
-
13
-
14
-
15
-
16
-
17
-
18
-
19
-
20
-
21
-
22
-
23
-
24
-
25
-
 26
26 -
 27
27 -
 28
28 -
 29
29 -
 30
30 -
 31
31 -
 32
32 -
 33
33 -
 34
34 -
 35
35 -
 36
36 -
 37
37 -
 38
38 -
 39
39 -
 40
40 -
 41
41 -
 42
42 -
 43
43 -
 44
44 -
 45
45 -
 46
46 -
47
-
48
-
49
-
50
-
51
-
52
-
53
-
54
-
55
-
56
-
57
-
58
-
59
-
60
-
61
-
62
-
63
-
64
-
65
-
66
-
67
-
68
-
69
-
70
-
71
-
72
-
73
-
74
-
75
-
76
-
77
-
78
-
79
-
80
-
81
-
82
-
83
-
84
 |
 |
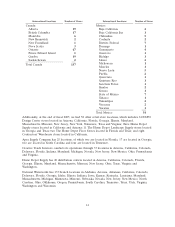
self-checkout registers, in 1,272 stores as of the end of fiscal 2005, grew our centralized automatic
replenishment program, commenced vendor certification for certified receiving and implemented an
in-store Special Order Services Initiative pilot in 285 stores as of the end of fiscal 2005. We believe
these initiatives will enhance our customers’ shopping experience as they are fully implemented in our
stores.
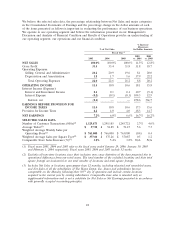
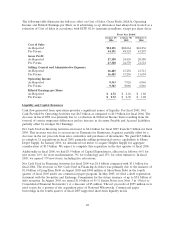
Gross Profit
Gross Profit increased 11.8% to $27.3 billion for fiscal 2005 from $24.4 billion for fiscal 2004. Gross
Profit as a percent of Net Sales increased 10 basis points to 33.5% for fiscal 2005, the highest annual
rate in our Company’s history. Our gross profit margin was impacted by a number of factors during the
year including a change in the mix of merchandise sold, markdowns taken in connection with our
decision to close or convert 20 EXPO stores, the increasing penetration of our Home Depot Supply
business and the cost of our deferred interest programs. Through our private label credit card we offer
no interest/no payment programs. The deferred interest associated with these programs is included in
Cost of Sales. We believe these programs deliver long-term benefits, including higher average ticket and
customer loyalty. For fiscal 2005, the penetration of our private label credit sales was 25.6% compared
to 24.1% for fiscal 2004.
Operating Expenses
Operating Expenses increased 8.8% to $18.0 billion for fiscal 2005 from $16.5 billion for fiscal 2004.
Operating Expenses as a percent of Net Sales were 22.0% for fiscal 2005 compared to 22.6% for fiscal
2004.
Selling, General and Administrative Expenses (‘‘SG&A’’) increased 8.1% to $16.5 billion for fiscal 2005
from $15.3 billion for fiscal 2004. As a percent of Net Sales, SG&A was 20.2% for fiscal 2005
compared to 20.9% for fiscal 2004. The reduction of SG&A as a percent of Net Sales for fiscal 2005
was primarily a result of continued focus on cost take-out initiatives and driving productivity gains
throughout the Company. We also continue to see benefits from our private label credit card, which
carries a lower discount rate than other forms of credit, like bank cards. In fiscal 2005, we recorded
$52 million of income related to gift card breakage as a reduction of SG&A. Fiscal 2005 was the first
year in which we recognized gift card breakage, and therefore, the amount recognized in fiscal 2005
includes the breakage income related to gift cards sold since the inception of our gift card program.
While we expect to continue to recognize gift card breakage in future periods, the amounts will be
significantly less than in fiscal 2005 due to the one-time multi-year inclusion in fiscal 2005. Finally, for
fiscal 2005, we recorded $91 million of impairment charges and expense related to lease obligations in
connection with our decision to close or convert 20 EXPO stores.
Depreciation and Amortization increased 17.9% to $1.5 billion for fiscal 2005 from $1.2 billion for
fiscal 2004. Depreciation and Amortization as a percent of Net Sales was 1.8% for fiscal 2005 and 1.7%
for fiscal 2004. The increase as a percent of Net Sales was primarily due to our investments in store
modernization and technology.
Interest, net
In fiscal 2005, we recognized $81 million of net Interest Expense compared to $14 million in fiscal
2004. Net Interest Expense as a percent of Net Sales was 0.1% for fiscal 2005 and less than 0.1% for
fiscal 2004. Interest Expense increased to $143 million for fiscal 2005 from $70 million for fiscal 2004
primarily due to additional interest incurred related to the August 2005 $1.0 billion issuance of 45⁄8%
Senior Notes and the September 2004 $1.0 billion issuance of 33⁄4% Senior Notes. Interest and
Investment Income increased 10.7% to $62 million for fiscal 2005 from $56 million for fiscal 2004 due
primarily to a higher interest rate environment.
24