Home Depot 2005 Annual Report Download - page 37
Download and view the complete annual report
Please find page 37 of the 2005 Home Depot annual report below. You can navigate through the pages in the report by either clicking on the pages listed below, or by using the keyword search tool below to find specific information within the annual report.-
 1
1 -
2
-
3
-
4
-
5
-
6
-
7
-
8
-
9
-
10
-
11
-
12
-
13
-
14
-
15
-
16
-
17
-
18
-
19
-
20
-
21
-
22
-
23
-
24
-
25
-
26
-
 27
27 -
 28
28 -
 29
29 -
 30
30 -
 31
31 -
 32
32 -
 33
33 -
 34
34 -
 35
35 -
 36
36 -
 37
37 -
 38
38 -
 39
39 -
 40
40 -
 41
41 -
 42
42 -
 43
43 -
 44
44 -
 45
45 -
 46
46 -
 47
47 -
48
-
49
-
50
-
51
-
52
-
53
-
54
-
55
-
56
-
57
-
58
-
59
-
60
-
61
-
62
-
63
-
64
-
65
-
66
-
67
-
68
-
69
-
70
-
71
-
72
-
73
-
74
-
75
-
76
-
77
-
78
-
79
-
80
-
81
-
82
-
83
-
84
 |
 |
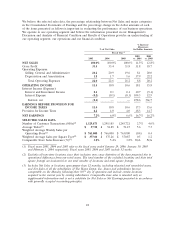
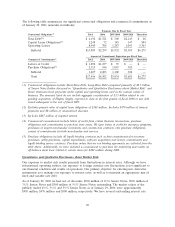
Provision for Income Taxes
Our combined federal and state effective income tax rate increased to 37.1% for fiscal 2005 from
36.8% for fiscal 2004. The majority of the increase in our effective income tax rate was due to an
increase in the state effective tax rate in fiscal 2005.
The American Jobs Creation Act of 2004 (‘‘AJC Act’’) provides a one-time 85% dividends-received
deduction that applies to qualified cash dividends received from controlled foreign corporations if the
funds are reinvested in the United States. The deduction can result in an effective income tax rate of
5.25% on the repatriation of foreign earnings, a rate much lower than the normal statutory tax rate of
35%. The Company has determined that it will not repatriate earnings of foreign subsidiaries under the
AJC Act.
The AJC Act also provides a new deduction for qualified domestic production activities. When fully
phased-in, the deduction will be up to 9% of the lesser of qualified production activities income or
taxable income. Because this provision is targeted toward manufacturing activities, the Company does
not expect to recognize a material benefit in the current or future tax years.
Diluted Earnings per Share
Diluted Earnings per Share were $2.72 and $2.26 for fiscal 2005 and fiscal 2004, respectively. Diluted
Earnings per Share were favorably impacted in both fiscal 2005 and fiscal 2004 as a result of the
repurchase of shares of our common stock under our $11.0 billion repurchase authorization. Over the
past four fiscal years, we have repurchased approximately 277 million shares of our common stock for a
total of $9.7 billion. On February 23, 2006 our Board of Directors authorized an additional $1.0 billion
for share repurchases, bringing our total authorization to $12.0 billion. In fiscal 2006, we estimate
Diluted Earnings per Share growth of 10% to 14%.
Fiscal 2004 Compared to Fiscal Year Ended February 1, 2004 (‘‘fiscal 2003’’)
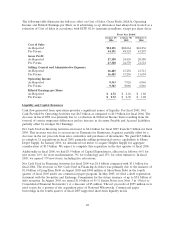
Net Sales
Net Sales for fiscal 2004 increased 12.8% to $73.1 billion from $64.8 billion for fiscal 2003. Fiscal 2004
Net Sales growth was driven by an increase in comparable store sales of 5.4%, sales from the 183 net
new stores opened during fiscal 2004, sales from the 175 net new stores opened during fiscal 2003 and
sales from our newly acquired businesses.
The increase in comparable store sales in fiscal 2004 reflects a number of factors. Our average ticket,
which increased 7.3% to $54.89, increased in all selling departments and our comparable store sales
growth in fiscal 2004 was positive in all selling departments. We experienced strong comparable store
sales increases in building materials due in part to the impact of several hurricanes in the Southeastern
U.S. Lumber was another strong category during fiscal 2004, driven primarily by commodity price
inflation. Additionally, we had strong sales growth in our kitchen and bath categories, driven by
appliances, bath fixtures, vanities and sinks. Finally, our comparable store sales growth in fiscal 2004
reflects the impact of cannibalization. As of the end of fiscal 2004, certain new stores cannibalized
approximately 17% of our existing stores and we estimate that store cannibalization reduced fiscal 2004
comparable store sales by approximately 2.2%.
The growth in Net Sales for fiscal 2004 reflects growth in services revenue, which increased 28% to
$3.6 billion for fiscal 2004 from $2.8 billion for fiscal 2003, driven by strength in a number of areas
including countertops, HVAC, kitchens and our flooring companies.
25