Home Depot 2005 Annual Report Download - page 61
Download and view the complete annual report
Please find page 61 of the 2005 Home Depot annual report below. You can navigate through the pages in the report by either clicking on the pages listed below, or by using the keyword search tool below to find specific information within the annual report.-
 1
1 -
2
-
3
-
4
-
5
-
6
-
7
-
8
-
9
-
10
-
11
-
12
-
13
-
14
-
15
-
16
-
17
-
18
-
19
-
20
-
21
-
22
-
23
-
24
-
25
-
26
-
27
-
28
-
29
-
30
-
31
-
32
-
33
-
34
-
35
-
36
-
37
-
38
-
39
-
40
-
41
-
42
-
43
-
44
-
45
-
46
-
47
-
48
-
49
-
50
-
 51
51 -
 52
52 -
 53
53 -
 54
54 -
 55
55 -
 56
56 -
 57
57 -
 58
58 -
 59
59 -
 60
60 -
 61
61 -
 62
62 -
 63
63 -
 64
64 -
 65
65 -
 66
66 -
 67
67 -
 68
68 -
 69
69 -
 70
70 -
 71
71 -
72
-
73
-
74
-
75
-
76
-
77
-
78
-
79
-
80
-
81
-
82
-
83
-
84
 |
 |

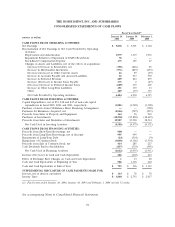
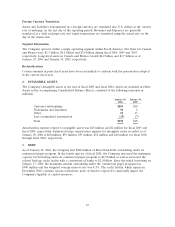
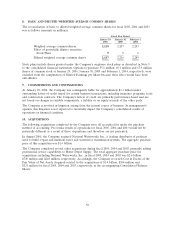
Maturities of Long-Term Debt are $513 million for fiscal 2006, $16 million for fiscal 2007, $300 million
for fiscal 2008, $1.0 billion for fiscal 2009, $1.0 billion for fiscal 2010 and $328 million thereafter.
As of January 29, 2006, the market values of the publicly traded 45⁄8% Senior Notes, 33⁄4% Senior Notes
and 53⁄8% Senior Notes were approximately $985 million, $976 million and $500 million, respectively.
The estimated fair value of all other long-term borrowings, excluding capital lease obligations, was
approximately $314 million compared to the carrying value of $312 million. These fair values were
estimated using a discounted cash flow analysis based on the Company’s incremental borrowing rate for
similar liabilities.
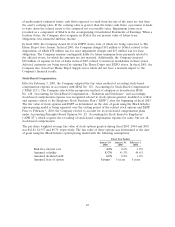
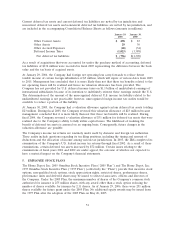
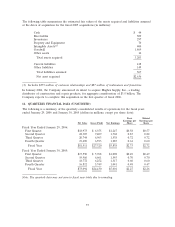
4. INCOME TAXES
The components of Earnings before Provision for Income Taxes for fiscal 2005, 2004 and 2003 are as
follows (amounts in millions):
Fiscal Year Ended
January 29, January 30, February 1,
2006 2005 2004
United States $8,736 $7,508 $6,440
Foreign 546 404 403
Total $9,282 $7,912 $6,843
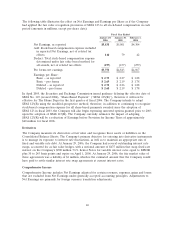
The Provision for Income Taxes consisted of the following (amounts in millions):
Fiscal Year Ended
January 29, January 30, February 1,
2006 2005 2004
Current:
Federal $3,394 $2,153 $1,520
State 507 279 307
Foreign 156 139 107
4,057 2,571 1,934
Deferred:
Federal (527) 304 573
State (111) 52 27
Foreign 25 (16) 5
(613) 340 605
Total $3,444 $2,911 $2,539
The Company’s combined federal, state and foreign effective tax rates for fiscal 2005, 2004 and 2003,
net of offsets generated by federal, state and foreign tax benefits, were approximately 37.1%, 36.8%
and 37.1%, respectively.
49