Home Depot 2005 Annual Report Download - page 51
Download and view the complete annual report
Please find page 51 of the 2005 Home Depot annual report below. You can navigate through the pages in the report by either clicking on the pages listed below, or by using the keyword search tool below to find specific information within the annual report.-
 1
1 -
2
-
3
-
4
-
5
-
6
-
7
-
8
-
9
-
10
-
11
-
12
-
13
-
14
-
15
-
16
-
17
-
18
-
19
-
20
-
21
-
22
-
23
-
24
-
25
-
26
-
27
-
28
-
29
-
30
-
31
-
32
-
33
-
34
-
35
-
36
-
37
-
38
-
39
-
40
-
 41
41 -
 42
42 -
 43
43 -
 44
44 -
 45
45 -
 46
46 -
 47
47 -
 48
48 -
 49
49 -
 50
50 -
 51
51 -
 52
52 -
 53
53 -
 54
54 -
 55
55 -
 56
56 -
 57
57 -
 58
58 -
 59
59 -
 60
60 -
 61
61 -
62
-
63
-
64
-
65
-
66
-
67
-
68
-
69
-
70
-
71
-
72
-
73
-
74
-
75
-
76
-
77
-
78
-
79
-
80
-
81
-
82
-
83
-
84
 |
 |

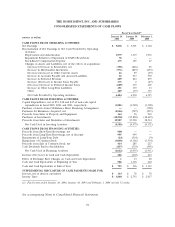
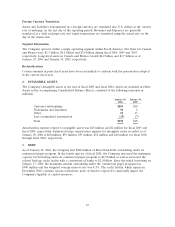
THE HOME DEPOT, INC. AND SUBSIDIARIES
CONSOLIDATED STATEMENTS OF CASH FLOWS
Fiscal Year Ended(1)
January 29, January 30, February 1,
amounts in millions 2006 2005 2004
CASH FLOWS FROM OPERATING ACTIVITIES:
Net Earnings $ 5,838 $ 5,001 $ 4,304
Reconciliation of Net Earnings to Net Cash Provided by Operating
Activities:
Depreciation and Amortization 1,579 1,319 1,076
Impairment Related to Disposition of EXPO Real Estate 78 ——
Stock-Based Compensation Expense 175 125 67
Changes in Assets and Liabilities, net of the effects of acquisitions:
(Increase) Decrease in Receivables, net (358) (266) 25
Increase in Merchandise Inventories (971) (849) (693)
Decrease (Increase) in Other Current Assets 16 29 (49)
Increase in Accounts Payable and Accrued Liabilities 12 917 790
Increase in Deferred Revenue 209 263 279
Increase (Decrease) in Income Taxes Payable 175 2 (27)
(Decrease) Increase in Deferred Income Taxes (609) 319 605
Increase in Other Long-Term Liabilities 151 119 33
Other 189 (75) 135
Net Cash Provided by Operating Activities 6,484 6,904 6,545
CASH FLOWS FROM INVESTING ACTIVITIES:
Capital Expenditures, net of $51, $38 and $47 of non-cash capital
expenditures in fiscal 2005, 2004 and 2003, respectively (3,881) (3,948) (3,508)
Purchase of Assets from Off-Balance Sheet Financing Arrangement —— (598)
Payments for Businesses Acquired, net (2,546) (727) (215)
Proceeds from Sales of Property and Equipment 164 96 265
Purchases of Investments (18,230) (25,890) (38,649)
Proceeds from Sales and Maturities of Investments 19,907 25,990 38,534
Net Cash Used in Investing Activities (4,586) (4,479) (4,171)
CASH FLOWS FROM FINANCING ACTIVITIES:
Proceeds from Short-Term Borrowings, net 900 ——
Proceeds from Long-Term Borrowings, net of discount 995 995 —
Repayments of Long-Term Debt (24) (510) (9)
Repurchase of Common Stock (3,040) (3,106) (1,554)
Proceeds from Sale of Common Stock, net 414 285 227
Cash Dividends Paid to Stockholders (857) (719) (595)
Net Cash Used in Financing Activities (1,612) (3,055) (1,931)
Increase (Decrease) in Cash and Cash Equivalents 286 (630) 443
Effect of Exchange Rate Changes on Cash and Cash Equivalents 133 20
Cash and Cash Equivalents at Beginning of Year 506 1,103 640
Cash and Cash Equivalents at End of Year $ 793 $ 506 $ 1,103
SUPPLEMENTAL DISCLOSURE OF CASH PAYMENTS MADE FOR:
Interest, net of interest capitalized $ 114 $78$70
Income Taxes $ 3,860 $ 2,793 $ 2,037
(1) Fiscal years ended January 29, 2006, January 30, 2005 and February 1, 2004 include 52 weeks.
See accompanying Notes to Consolidated Financial Statements.
39