Home Depot 2005 Annual Report Download - page 35
Download and view the complete annual report
Please find page 35 of the 2005 Home Depot annual report below. You can navigate through the pages in the report by either clicking on the pages listed below, or by using the keyword search tool below to find specific information within the annual report.-
 1
1 -
2
-
3
-
4
-
5
-
6
-
7
-
8
-
9
-
10
-
11
-
12
-
13
-
14
-
15
-
16
-
17
-
18
-
19
-
20
-
21
-
22
-
23
-
24
-
 25
25 -
 26
26 -
 27
27 -
 28
28 -
 29
29 -
 30
30 -
 31
31 -
 32
32 -
 33
33 -
 34
34 -
 35
35 -
 36
36 -
 37
37 -
 38
38 -
 39
39 -
 40
40 -
 41
41 -
 42
42 -
 43
43 -
 44
44 -
 45
45 -
46
-
47
-
48
-
49
-
50
-
51
-
52
-
53
-
54
-
55
-
56
-
57
-
58
-
59
-
60
-
61
-
62
-
63
-
64
-
65
-
66
-
67
-
68
-
69
-
70
-
71
-
72
-
73
-
74
-
75
-
76
-
77
-
78
-
79
-
80
-
81
-
82
-
83
-
84
 |
 |

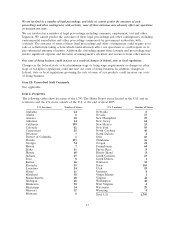
Results of Operations
For an understanding of the significant factors that influenced our performance during the past three
fiscal years, the following discussion should be read in conjunction with the Consolidated Financial
Statements and the Notes to Consolidated Financial Statements presented in this Annual Report.
Fiscal 2005 Compared to Fiscal 2004
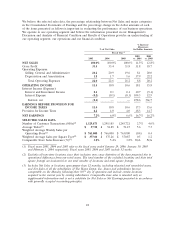
Net Sales
Net Sales for fiscal 2005 increased 11.5% to $81.5 billion from $73.1 billion for fiscal 2004. Fiscal 2005
Net Sales growth was driven by an increase in comparable store sales of 3.8%, sales from new stores
opened during fiscal 2005 and fiscal 2004 and sales from our newly acquired businesses. Assuming the
acquisition of Hughes Supply closes in the first quarter of 2006, we expect sales growth of 14% to 17%
for fiscal 2006, driven by comparable store sales growth, sales from new stores opened during fiscal
2005 and fiscal 2006 and sales from newly acquired businesses, including Hughes Supply.
The increase in comparable store sales in fiscal 2005 reflects a number of factors. The retail stores
contributed 3.0% of comparable store sales growth and Home Depot Supply contributed 80 basis
points of comparable store sales growth. In the retail stores, our average ticket, which increased 5.6%
to a record $57.98, increased in all selling departments and our comparable store sales growth in fiscal
2005 was positive in 9 of 10 selling departments. Building materials had the strongest comparable store
sales increase through sales growth of gypsum, roofing, concrete and insulation, due in part to the
impact of one of the most destructive hurricane seasons in modern U.S. history. We experienced strong
comparable store sales growth in kitchen and bath driven by continued growth in appliances and
kitchen installations. We also experienced strong comparable store sales in our Pro categories, including
plumbing, electrical and hardware in fiscal 2005. The impact of cannibalization partially offset our fiscal
2005 comparable store sales growth.
In order to meet our customer service objectives, we strategically open stores near market areas served
by existing stores (‘‘cannibalize’’) to enhance service levels, gain incremental sales and increase market
penetration. As of the end of fiscal 2005, certain new stores cannibalized approximately 20% of our
existing stores and we estimate that store cannibalization reduced fiscal 2005 comparable store sales by
approximately 1.8%. Additionally, we believe that our sales performance has been, and could continue
to be, negatively impacted by the level of competition that we encounter in various markets. However,
due to the highly-fragmented U.S. home improvement and professional supply industry, in which we
estimate our market share is approximately 11%, measuring the impact on our sales by our competitors
is extremely difficult.
The growth in Net Sales for fiscal 2005 reflects growth in services revenue, which increased 21.4% to
$4.3 billion for fiscal 2005 from $3.6 billion for fiscal 2004. The growth in services revenue was driven
by strength in a number of areas including countertops, roofing, kitchens, windows and HVAC. We
continued to drive our services programs, which focus primarily on providing products and services to
our do-it-for-me customers. We also arrange for the provision of flooring, countertop, cabinet, and
window covering installation services to production home builders through our Creative Touch Interiors
brand. Our services revenue is expected to benefit from the growing percentage of aging
‘‘baby-boomers’’ as they rely more heavily on installation services.
We continue to invest in our stores to improve store efficiency and the overall customer shopping
experience. In fiscal 2005, we completed the rollout of our back-end automation and re-engineering
(‘‘BEAR’’) project to all stores in the U.S. and Canada. Among other things, this initiative improves
operational execution and productivity through the automation of our receiving process in the stores,
enabling us to reallocate resources to the selling floor. During fiscal 2005, we continued the
implementation or expansion of a number of other in-store initiatives. We continued the installation of
23