Home Depot 2005 Annual Report Download - page 2
Download and view the complete annual report
Please find page 2 of the 2005 Home Depot annual report below. You can navigate through the pages in the report by either clicking on the pages listed below, or by using the keyword search tool below to find specific information within the annual report.-
 1
1 -
 2
2 -
 3
3 -
 4
4 -
 5
5 -
 6
6 -
 7
7 -
 8
8 -
 9
9 -
 10
10 -
 11
11 -
 12
12 -
 13
13 -
14
-
15
-
16
-
17
-
18
-
19
-
20
-
21
-
22
-
23
-
24
-
25
-
26
-
27
-
28
-
29
-
30
-
31
-
32
-
33
-
34
-
35
-
36
-
37
-
38
-
39
-
40
-
41
-
42
-
43
-
44
-
45
-
46
-
47
-
48
-
49
-
50
-
51
-
52
-
53
-
54
-
55
-
56
-
57
-
58
-
59
-
60
-
61
-
62
-
63
-
64
-
65
-
66
-
67
-
68
-
69
-
70
-
71
-
72
-
73
-
74
-
75
-
76
-
77
-
78
-
79
-
80
-
81
-
82
-
83
-
84
 |
 |

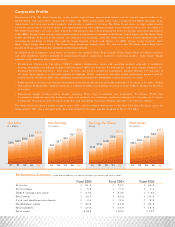
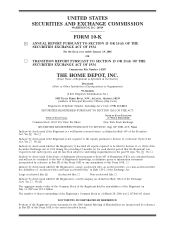
Net Sales
($ in billions)
‘01 ‘02 ‘03 ‘04
‘05
‘01 ‘02 ‘03 ‘04
‘05
‘01 ‘02 ‘03 ‘04
‘05
‘01 ‘02 ‘03 ‘04
‘05
$53.6 $58.2 $64.8 $73.1 $81.5
$3.0
$3.7
$4.3
$5.0
$5.8
$1.29 $1.56 $1.88
$2.26
$2.72
$26.4 $30.0 $34.4 $39.0
$44.5
Net Earnings
($ in billions)
Earnings Per Share
(diluted)
Total Assets
($ in billions)
Corporate Profile
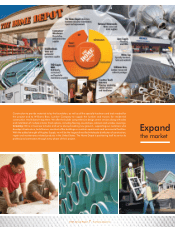
Founded in 19 7 8, The Home Depot Inc. is the world’s largest home improvement retailer and the second largest retailer in the
United States, with fiscal 2005 sales o f $ 81.5 billion. The Home Depot sto res sell a wide assortment of building materials, home
improvement and lawn and garden products and provide a number of services. The Home Depot stores average approximately
105,000 square feet of enclosed space, with approximately 2 3,000 additional square feet of outside G arden area. In addition to
The Home Depot stores, we have a store format that sells products and services primarily for home deco rating and remodeling projects
called EXPO Design Center and two store formats focused on professional customers called Home Depot Supply and The Home Depot
Landscape Supply. At the end o f fiscal 20 0 5, the Co mpany was operating 1,9 8 4 The Home Depot stores located throughout the U.S.
(including the territories of Puerto Rico and the Virgin Islands), Canada and Mexico, 3 4 EXPO Design Center locatio ns, three
Home Depot Supply stores and 11 The Home Depot Landscape Supply stores. We also have two The Home Depot Floor Stores
located in Texas and Florida that primarily sell flooring pro ducts.
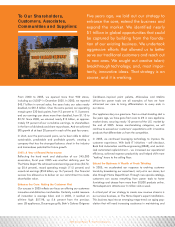
In addition to the Company’s retail sto res, its business also includes Home Depot Supply. Home Depot Supply distributes products
and sells installatio n services primarily to professional business contractors, businesses and municipalities. Home Depot Supply
operates in the following three primary areas:
• Maintenance, Repair and O perations (“MRO ”) supplies maintenance, repair and o perating products primarily to multifamily
housing, hospitality and lo dging facilities. Included under MRO are National Waterworks Inc. and Apex Supply Company Inc.
National W aterworks provides a wide range of water and wastewater-related transmission products through 13 7 branches in
36 states. Apex Supply is a wholesale supplier of plumbing, HVAC, appliances and other related pro fessio nal pro ducts with 25
locatio ns in the So utheast. MRO also distributes its products through 2 0 distribution centers located in 1 4 states.
• Builder pro vides pro ducts and arranges installation services for productio n home builders through 37 lo cations in 14 states. Builder
also includes W illiams Bros. Lumber Company, a supplier of lumber and building materials to home builders through 1 6 branches
in G eorgia.
• Pro fessio nal Supply includes various brands, including W hite Cap Constructio n and Contracto rs’ W arehouse. W hite Cap
Constructio n distributes specialty hardware, too ls and materials to construction contractors through 103 branches in 23 states.
Contractors’ W arehouse caters to small contractors and remodeling tradesmen through eight stores located in California.
The Home Depot has been a public company since 1 981, and its co mmon stock trades o n the New York Stock Exchange under the
ticker symbol “HD” and is included in the Dow Jones Industrial Average and the Standard & Poor’s 5 00 Index.
Performance Summary: (amounts in billions, except for earnings per share and store co unt)
Fiscal 2005 Fiscal 2004 Fiscal 2003
Net sales 81 .5 73 .1 64 .8
Net earnings 5.8 5.0 4.3
Diluted earnings per share 2.72 2.26 1.88
Total assets 44 .5 39 .0 34 .4
Cash and short-term investments 0.8 2.2 2.9
Stockholders’ equity 26 .9 24 .2 22 .4
Total liabilities 17 .6 14 .9 12 .0
Store count 2,042 1,890 1,707
$
$
$
$
$
$
$
$
$
$
$
$
$
$
$
$
$
$
$
$
$