Home Depot 2005 Annual Report Download - page 40
Download and view the complete annual report
Please find page 40 of the 2005 Home Depot annual report below. You can navigate through the pages in the report by either clicking on the pages listed below, or by using the keyword search tool below to find specific information within the annual report.-
 1
1 -
2
-
3
-
4
-
5
-
6
-
7
-
8
-
9
-
10
-
11
-
12
-
13
-
14
-
15
-
16
-
17
-
18
-
19
-
20
-
21
-
22
-
23
-
24
-
25
-
26
-
27
-
28
-
29
-
 30
30 -
 31
31 -
 32
32 -
 33
33 -
 34
34 -
 35
35 -
 36
36 -
 37
37 -
 38
38 -
 39
39 -
 40
40 -
 41
41 -
 42
42 -
 43
43 -
 44
44 -
 45
45 -
 46
46 -
 47
47 -
 48
48 -
 49
49 -
 50
50 -
51
-
52
-
53
-
54
-
55
-
56
-
57
-
58
-
59
-
60
-
61
-
62
-
63
-
64
-
65
-
66
-
67
-
68
-
69
-
70
-
71
-
72
-
73
-
74
-
75
-
76
-
77
-
78
-
79
-
80
-
81
-
82
-
83
-
84
 |
 |

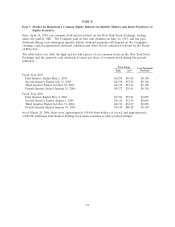
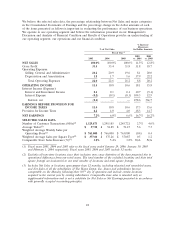
The following table illustrates the full-year effect on Cost of Sales, Gross Profit, SG&A, Operating
Income and Diluted Earnings per Share as if advertising co-op allowances had always been treated as a
reduction of Cost of Sales in accordance with EITF 02-16 (amounts in millions, except per share data):
Fiscal Year Ended
January 29, January 30, February 1,
2006 2005 2004
Cost of Sales
As Reported $54,191 $48,664 $44,236
Pro Forma 54,191 48,524 43,295
Gross Profit
As Reported 27,320 24,430 20,580
Pro Forma 27,320 24,570 21,521
Selling, General and Administrative Expenses
As Reported 16,485 15,256 12,713
Pro Forma 16,485 15,256 13,654
Operating Income
As Reported 9,363 7,926 6,846
Pro Forma 9,363 8,066 6,846
Diluted Earnings per Share
As Reported $ 2.72 $ 2.26 $ 1.88
Pro Forma $ 2.72 $ 2.30 $ 1.88
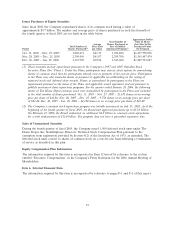
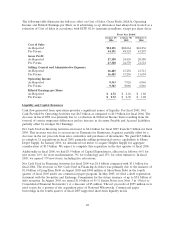
Liquidity and Capital Resources
Cash flow generated from operations provides a significant source of liquidity. For fiscal 2005, Net
Cash Provided by Operating Activities was $6.5 billion as compared to $6.9 billion for fiscal 2004. The
decrease in fiscal 2005 was primarily due to a reduction in Deferred Income Taxes resulting from the
reversal of certain temporary differences and no increase in Accounts Payable and Accrued Liabilities
partially offset by stronger Net Earnings.
Net Cash Used in Investing Activities increased to $4.6 billion for fiscal 2005 from $4.5 billion for fiscal
2004. This increase was due to an increase in Payments for Businesses Acquired, partially offset by a
decrease in the net proceeds from sales, maturities and purchases of investments. We paid $2.5 billion
to complete 21 acquisitions in fiscal 2005, primarily adding professional service capabilities to Home
Depot Supply. In January 2006, we announced our intent to acquire Hughes Supply for aggregate
consideration of $3.5 billion. We expect to complete this acquisition in the first quarter of fiscal 2006.
Additionally in fiscal 2005, we had $3.9 billion of Capital Expenditures, allocated as follows: 66% for
new stores, 10% for store modernization, 9% for technology and 15% for other initiatives. In fiscal
2005, we opened 179 new stores, including five relocations.
Net Cash Used in Financing Activities for fiscal 2005 was $1.6 billion compared with $3.1 billion for
fiscal 2004. The decrease in Net Cash Used in Financing Activities was primarily due to the issuance of
$1.0 billion of Long-Term Debt in August 2005 and $900 million of Short-Term Debt in the fourth
quarter of fiscal 2005 under our commercial paper program. In May 2005, we filed a shelf registration
statement with the Securities and Exchange Commission for the future issuance of up to $5.0 billion of
debt securities. In August 2005, we issued $1.0 billion of 45⁄8% Senior Notes (see Note 3 in ‘‘Notes to
Consolidated Financial Statements’’) at a discount of $5 million. The net proceeds of $995 million were
used to pay for a portion of the acquisition price of National Waterworks. Commercial paper
borrowings in the fourth quarter of fiscal 2005 supported short-term liquidity needs.
28