Home Depot 2005 Annual Report Download - page 65
Download and view the complete annual report
Please find page 65 of the 2005 Home Depot annual report below. You can navigate through the pages in the report by either clicking on the pages listed below, or by using the keyword search tool below to find specific information within the annual report.-
 1
1 -
2
-
3
-
4
-
5
-
6
-
7
-
8
-
9
-
10
-
11
-
12
-
13
-
14
-
15
-
16
-
17
-
18
-
19
-
20
-
21
-
22
-
23
-
24
-
25
-
26
-
27
-
28
-
29
-
30
-
31
-
32
-
33
-
34
-
35
-
36
-
37
-
38
-
39
-
40
-
41
-
42
-
43
-
44
-
45
-
46
-
47
-
48
-
49
-
50
-
51
-
52
-
53
-
54
-
 55
55 -
 56
56 -
 57
57 -
 58
58 -
 59
59 -
 60
60 -
 61
61 -
 62
62 -
 63
63 -
 64
64 -
 65
65 -
 66
66 -
 67
67 -
 68
68 -
 69
69 -
 70
70 -
 71
71 -
 72
72 -
 73
73 -
 74
74 -
 75
75 -
76
-
77
-
78
-
79
-
80
-
81
-
82
-
83
-
84
 |
 |

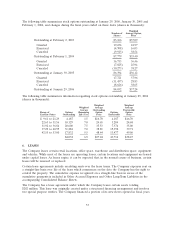
The following table summarizes stock options outstanding at January 29, 2006, January 30, 2005 and
February 1, 2004, and changes during the fiscal years ended on these dates (shares in thousands):
Weighted
Number of Average Option
Shares Price
Outstanding at February 2, 2003 83,166 $37.09
Granted 19,234 24.97
Exercised (4,708) 16.03
Canceled (9,913) 38.54
Outstanding at February 1, 2004 87,779 $35.40
Granted 16,713 36.46
Exercised (7,825) 25.94
Canceled (10,273) 38.27
Outstanding at January 30, 2005 86,394 $36.12
Granted 17,721 37.96
Exercised (11,457) 28.83
Canceled (8,626) 38.65
Outstanding at January 29, 2006 84,032 $37.24
The following table summarizes information regarding stock options outstanding at January 29, 2006
(shares in thousands):
Weighted Weighted
Weighted Average Average
Average Outstanding Exercisable
Range of Options Remaining Option Options Option
Exercise Prices Outstanding Life (Yrs.) Price Exercisable Price
$ 9.61 to 21.29 4,187 1.5 $16.70 4,187 $16.70
22.63 to 31.56 10,129 7.0 24.65 3,284 24.68
31.92 to 36.84 20,600 7.5 35.53 7,374 35.00
37.29 to 40.95 31,284 7.0 38.81 15,392 39.71
42.55 to 53.00 17,832 5.5 48.44 13,477 49.06
84,032 6.5 $37.24 43,714 $38.47
6. LEASES
The Company leases certain retail locations, office space, warehouse and distribution space, equipment
and vehicles. While most of the leases are operating leases, certain locations and equipment are leased
under capital leases. As leases expire, it can be expected that, in the normal course of business, certain
leases will be renewed or replaced.
Certain lease agreements include escalating rents over the lease terms. The Company expenses rent on
a straight-line basis over life of the lease which commences on the date the Company has the right to
control the property. The cumulative expense recognized on a straight-line basis in excess of the
cumulative payments is included in Other Accrued Expenses and Other Long-Term Liabilities in the
accompanying Consolidated Balance Sheets.
The Company has a lease agreement under which the Company leases certain assets totaling
$282 million. This lease was originally created under a structured financing arrangement and involves
two special purpose entities. The Company financed a portion of its new stores opened in fiscal years
53