Holiday Inn 2011 Annual Report Download - page 54
Download and view the complete annual report
Please find page 54 of the 2011 Holiday Inn annual report below. You can navigate through the pages in the report by either clicking on the pages listed below, or by using the keyword search tool below to find specific information within the annual report.-
 1
1 -
2
-
3
-
4
-
5
-
6
-
7
-
8
-
9
-
10
-
11
-
12
-
13
-
14
-
15
-
16
-
17
-
18
-
19
-
20
-
21
-
22
-
23
-
24
-
25
-
26
-
27
-
28
-
29
-
30
-
31
-
32
-
33
-
34
-
35
-
36
-
37
-
38
-
39
-
40
-
41
-
42
-
43
-
 44
44 -
 45
45 -
 46
46 -
 47
47 -
 48
48 -
 49
49 -
 50
50 -
 51
51 -
 52
52 -
 53
53 -
 54
54 -
 55
55 -
 56
56 -
 57
57 -
 58
58 -
 59
59 -
 60
60
 |
 |
52 IHG Annual Review and Summary Financial Statement 2011
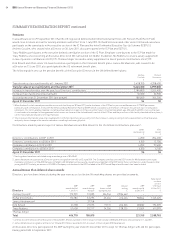
SUMMARY REMUNERATION REPORT continued
The measures used in the 2009/2011 cycle are set out in the table below:
Performance
measure
Threshold
performance
Maximum
performance
Threshold
vesting
Maximum
vesting Weighting
Maximum
award Outcome
TSR Growth equal to
the DJGH index
Growth exceeds the
index by 8% or more
20% 100% 66.7% 102.5% Growth exceeded
index by 7.9%
EPS Growth of 0%
per annum
Growth of 10%
per annum or more
0% 100% 33.3% 102.5% Growth of 2.5%
per annum
Total vesting
outcome
73.9% of maximum
award
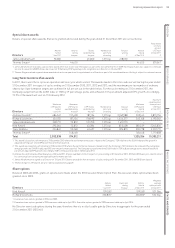
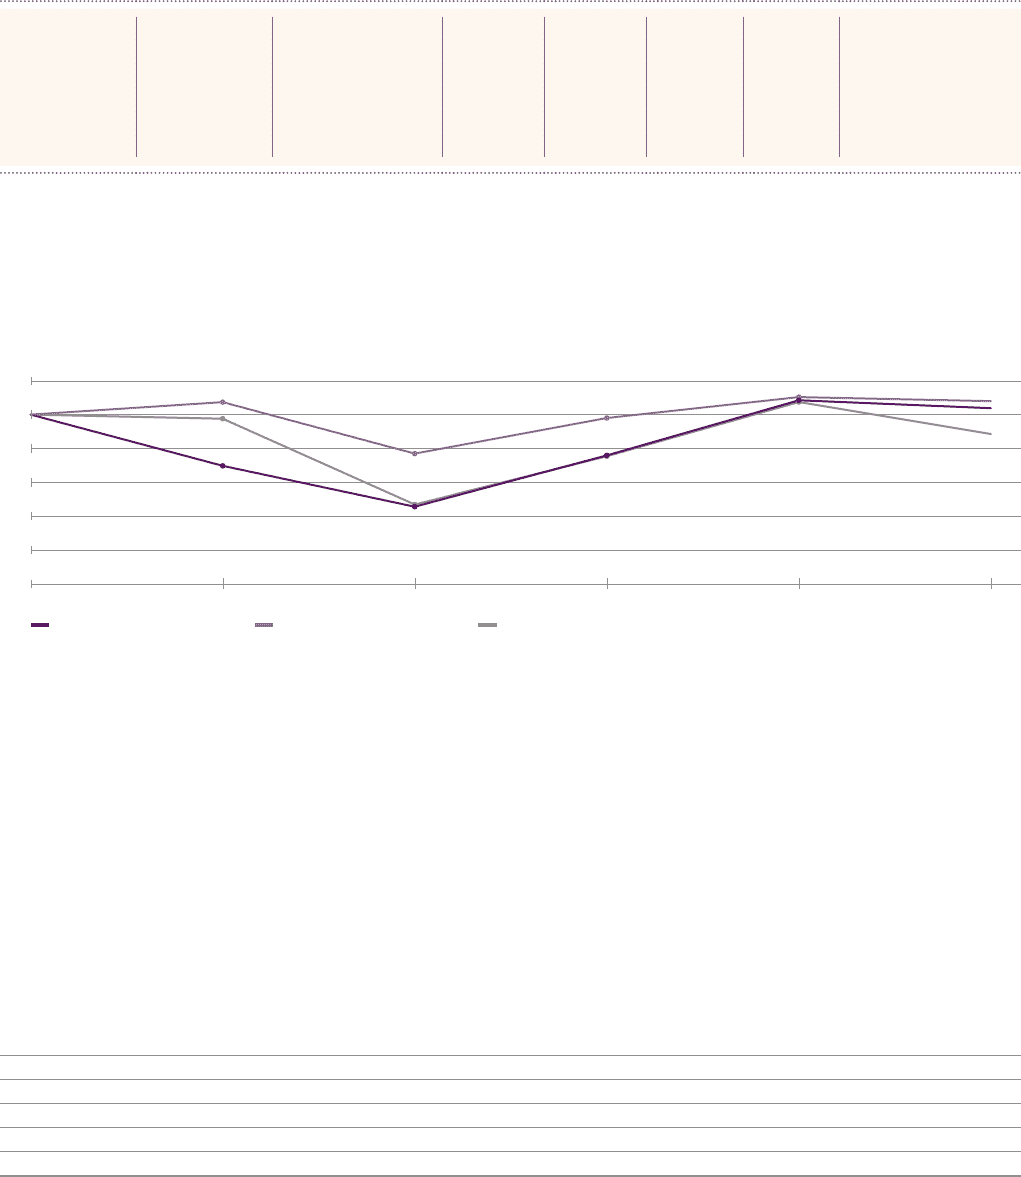
Performance graph
Throughout 2011, the Company was a member of the FTSE 100 index and, for remuneration purposes, used a TSR comparator group of
the DJGH index. Accordingly, the Committee has determined that these are the most appropriate market indices against which to test the
Company’s performance. The graph below shows the TSR performance of IHG from 31 December 2006 to 31 December 2011, assuming
dividends are reinvested, compared with the TSR performance achieved by the FTSE 100 index and the DJGH index. Over the five-year period,
IHG TSR performance increased by just under 4%. Over the last three years, it outperformed the FTSE 100 index and the DJGH index.
Total Shareholder Return: InterContinental Hotels Group PLC v FTSE 100 and v Dow Jones Global Hotels index
Source: Datastream
InterContinental Hotels Group PLC
total shareholder return index
FTSE 100
total shareholder return index
Dow Jones Global Hotels
total shareholder return index
31 Dec 201131 Dec 201031 Dec 200931 Dec 200831 Dec 200731 Dec 2006
120
108
104
89
100
80
60
40
20
0
Share ownership
Executive Directors are expected to hold twice their base salary in shares, or three times in the case of the Chief Executive. Executive
Directors are expected to hold all shares earned (net of any share sales required to meet personal tax liabilities) until their shareholding
requirement is achieved. The required number of shares are held by Richard Solomons and Kirk Kinsell.
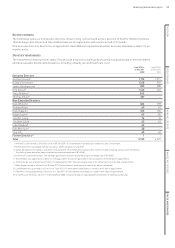
Non-Executive Directors
Non-Executive Directors are paid a fee which is agreed by the Board and the Chairman, taking into account fees paid in other companies
of a similar complexity. Higher fees are payable to the Senior Independent Director who chairs the Audit Committee and to the Chairmen
of the Remuneration and Corporate Responsibility Committees, reflecting the additional responsibilities of these roles.
Non-Executive Directors’ fee levels are reviewed annually. In the final quarter of 2011 an increase of approximately 2% for the Non-Executive
Directors was agreed from 1 January 2012 as shown below. This increase is broadly in line with anticipated salary increases for executive
and senior management employees across the wider organisation. The Chairman waived any right to an increase in respect of his fees
for 2012.
Fees at Fees at
1 Jan 2012 1 Jan 2011
Director Role £ £
David Webster Chairman 406,000 406,000
David Kappler Senior Independent Director and Chairman of Audit Committee 105,060 103,000
Luke Mayhew Chairman of Remuneration Committee 88,230 –
Jennifer Laing Chairman of Corporate Responsibility Committee 77,520 76,000
Others Non-Executive Director 66,300 65,000