Holiday Inn 2011 Annual Report Download - page 52
Download and view the complete annual report
Please find page 52 of the 2011 Holiday Inn annual report below. You can navigate through the pages in the report by either clicking on the pages listed below, or by using the keyword search tool below to find specific information within the annual report.
50 IHG Annual Review and Summary Financial Statement 2011
SUMMARY REMUNERATION REPORT continued
Total remuneration
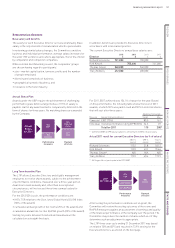
The chart below sets out the actual and potential maximum remuneration outcomes for 2011 performance for current Executive Directors
excluding Thomas Singer, who joined IHG in 2011 and did not participate in the 2011 ABP or receive any vested awards during the year.
The elements shown are as follows:
• Actual 2011 salary paid – for Richard Solomons, this is his actual pay for the year and reflects the salary increase that occurred part way
through the year in respect of his change in role to Chief Executive; for Kirk Kinsell this shows actual salary paid converted into sterling.
For Tracy Robbins, who joined the Board part way through the year, this represents 2011 actual salary paid, including salary paid prior
to becoming a Director;
• 2011 ABP cash – the cash portion of the ABP award made in respect of financial year 2011 performance;
• 2011 ABP deferred shares – the value of the deferred share portion of the ABP award made in respect of financial year 2011 performance; and
• 2009/2011 LTIP – the value at 31 December 2011, of the 2009/2011 LTIP award made in 2009, which will vest on 15 February 2012 based on
performance for the three years up to and including 2011.
The maximum figures represent the maximum value of each element of remuneration that could have been received in each case by the
Executive Director. For the 2009/2011 LTIP, the maximum value is based on the share price as at 31 December 2011.
2011 2011
Richard Solomons
Maximum Actual Maximum* Actual*Maximum Actual
2011
Tracy RobbinsKirk Kinsell
4,000
3,000
2,000
1,000
0
Value (£000)
■ Actual 2011 salary paid ■ 2011 ABP cash ■ 2011 ABP deferred shares ■ 2009/2011 LTIP
* Mr Kinsell is paid in US dollars and the sterling values in the chart above have been calculated using an exchange rate of $1=£0.62.
The percentage of total remuneration for 2011 that is performance-related exceeds the 70% level that would be payable for target
performance. This reflects above-target performance for both the 2011 ABP and the 2009/2011 LTIP.


