Holiday Inn 2011 Annual Report Download - page 43
Download and view the complete annual report
Please find page 43 of the 2011 Holiday Inn annual report below. You can navigate through the pages in the report by either clicking on the pages listed below, or by using the keyword search tool below to find specific information within the annual report.-
 1
1 -
2
-
3
-
4
-
5
-
6
-
7
-
8
-
9
-
10
-
11
-
12
-
13
-
14
-
15
-
16
-
17
-
18
-
19
-
20
-
21
-
22
-
23
-
24
-
25
-
26
-
27
-
28
-
29
-
30
-
31
-
32
-
 33
33 -
 34
34 -
 35
35 -
 36
36 -
 37
37 -
 38
38 -
 39
39 -
 40
40 -
 41
41 -
 42
42 -
 43
43 -
 44
44 -
 45
45 -
 46
46 -
 47
47 -
 48
48 -
 49
49 -
 50
50 -
 51
51 -
 52
52 -
 53
53 -
54
-
55
-
56
-
57
-
58
-
59
-
60
 |
 |

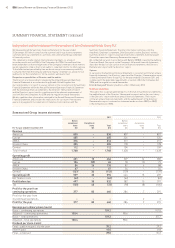
Summary financial statement 41
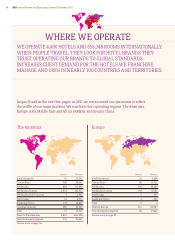
OVERVIEW GREAT BRANDS HOW WE OPERATE WHERE WE OPERATE FACTS AND FIGURES
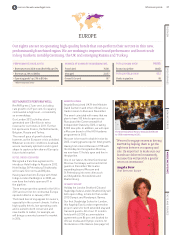
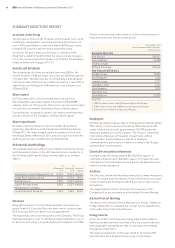
EUROPE RESULTS
Revenue and operating profit before
exceptional items increased by $79m
(24.2%) to $405m and by $26m (33.3%)
to $104m respectively.
Franchised revenue increased by $10m
(13.2%) to $86m and operating profit by
$10m (18.2%) to $65m. Growth was mainly
driven by royalties growth of 11.4%
reflecting RevPAR growth of 4.0%, together
with an increase in system size. Revenues
associated with new signings, relicensing
and terminations increased by $2m.
Managed revenue increased by $48m
to $118m (68.6%) and operating profit
increased by $9m to $26m (52.9%)
reflecting RevPAR growth of 5.5%,
together with the year-on-year benefit
of a $3m charge in 2010 with regard
to guarantee obligations for one hotel.
2011 also included revenue of $46m and
operating profit of $nil from two properties
which were converted from management
contracts to an operating lease structure
with the same characteristics as
management contracts.
In the owned and leased estate, revenue
increased by $21m (11.7%) to $201m and
operating profit increased by $11m (28.9%).
RevPAR growth of 10.9% benefited from
average daily rate growth of 10.3% across
the year. The InterContinental London
Park Lane and the InterContinental
Paris Le Grand delivered strong
year-on-year RevPAR growth of 7.3%
and 14.5% respectively.
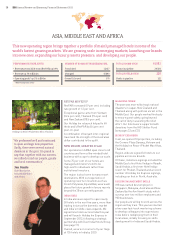
AMEA RESULTS
Revenue and operating profit before
exceptional items increased by $3m (1.4%)
to $216m and by $2m (2.4%) to $84m
respectively. The region’s results were
adversely impacted by the political
instability throughout 2011 in the Middle
East, together with the natural disasters
in Japan and New Zealand.
Franchised revenue increased by $4m
(26.7%) to $19m and operating profit by
$4m (50.0%) to $12m. RevPAR in the
franchised estate grew by 1.7%. Excluding
Egypt, Bahrain and Japan, RevPAR grew
by 4.4%.
Managed revenue decreased by $4m
(2.6%) to $151m and operating profit
decreased by $1m (1.1%) to $87m. The
events of the Arab Spring together with
the natural disasters in Japan and New
Zealand had an estimated adverse impact
of $11m on the results, whilst there was
a further $4m adverse impact due to
changes to certain management contract
terms. Results did however benefit from a
liquidated damages receipt of $6m during
the year. RevPAR grew by 0.6% compared
to 2010 and by 5.7% excluding Egypt,
Bahrain and Japan.
In the owned and leased estate, revenue
increased by $3m (7.0%) to $46m and
operating profit increased by $1m (25.0%).
GREATER CHINA RESULTS
Revenue and operating profit before
exceptional items increased by $27m
(15.2%) to $205m and by $13m (24.1%)
to $67m respectively.
Managed revenue increased by $17m
(28.3%) to $77m and operating profit
increased by $13m (43.3%) to $43m.
Continued strong economic growth in
the region helped to drive RevPAR growth
of 10.3%. Excluding Shanghai, where
RevPAR growth was tempered by strong
comparatives due to the World Expo held
in May to October 2010, comparable
RevPAR grew by 17.4%. There was also
continued significant system size growth
for the managed estate in the region (14.2%
rooms growth in 2011 and 12.6% in 2010).
Owned and leased revenue increased
by $10m (8.6%) to $126m and operating
profit increased by $4m (12.1%) to $37m.
The InterContinental Hong Kong
generated RevPAR growth of 13.4%.
CENTRAL RESULTS
During 2011, net central costs increased
by $8m from $139m to $147m (5.8%).
The movement was primarily driven by
increased investment to support growth
in the business. Central revenue mainly
comprised technology fee income.
OTHER FINANCIAL ITEMS
Exceptional operating items totalled a net
gain of $35m. Exceptional gains included
$37m from the disposal of hotels, including
$29m profit on the sale of the Holiday Inn
Burswood, a UK VAT refund of $9m, $20m
net impairment reversals and a $28m
pension curtailment gain in relation to the
closure of the UK defined benefit pension
scheme. Exceptional charges included a
$22m litigation provision and $37m in
respect of the settlement of a prior period
commercial dispute in Europe.
Net financial expenses remained flat
at $62m as costs relating to the new
syndicated bank facility offset the impact
of lower levels of net debt.
The effective rate of tax was 24% (2010 26%).
Basic earnings per ordinary share in 2011
was 159.2¢, compared with 101.7¢ in 2010.
Adjusted earnings per ordinary share
was 130.4¢, against 98.6¢ in 2010.
The Board has proposed a final dividend
per ordinary share of 39.0¢ (24.7p). With
the interim dividend per ordinary share
of 16.0¢ (9.8p), the full-year dividend per
ordinary share for 2011 will total 55.0¢
(34.5p).
CAPITAL STRUCTURE AND LIQUIDITY
MANAGEMENT
During the year, $479m of cash was
generated from operating activities, with
the other key elements of the cash flow
being proceeds from the disposal of
hotels of $142m and capital expenditure
of $194m. Overall, net debt decreased by
$205m to $538m.
This Summary Financial
Statement was approved by the
Board on 13 February 2012 and
signed on its behalf by Tom Singer.
It does not contain sufficient
information to provide as complete
an understanding of the Group’s
results and state of affairs as that
provided in the Annual Report
and Financial Statements 2011.
That report may be obtained, free
of charge, by writing to IHG or
the Company’s Registrar, Equiniti
(contact details are provided on
page 57).
The auditors have issued an
unqualified report on the financial
statements containing no statement
under section 498(2) or 498(3) of the
Companies Act 2006. Information
concerning Directors’ emoluments
is shown on pages 48 to 55.