Holiday Inn 2011 Annual Report Download - page 42
Download and view the complete annual report
Please find page 42 of the 2011 Holiday Inn annual report below. You can navigate through the pages in the report by either clicking on the pages listed below, or by using the keyword search tool below to find specific information within the annual report.-
 1
1 -
2
-
3
-
4
-
5
-
6
-
7
-
8
-
9
-
10
-
11
-
12
-
13
-
14
-
15
-
16
-
17
-
18
-
19
-
20
-
21
-
22
-
23
-
24
-
25
-
26
-
27
-
28
-
29
-
30
-
31
-
 32
32 -
 33
33 -
 34
34 -
 35
35 -
 36
36 -
 37
37 -
 38
38 -
 39
39 -
 40
40 -
 41
41 -
 42
42 -
 43
43 -
 44
44 -
 45
45 -
 46
46 -
 47
47 -
 48
48 -
 49
49 -
 50
50 -
 51
51 -
 52
52 -
53
-
54
-
55
-
56
-
57
-
58
-
59
-
60
 |
 |

40 IHG Annual Review and Summary Financial Statement 2011
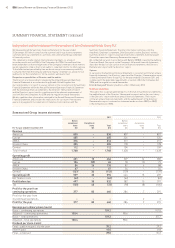
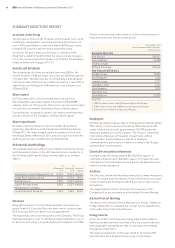
GROUP RESULTS
Revenue increased by 8.6% to $1,768m
and operating profit before exceptional
items increased by 25.9% to $559m
during the 12 months ended
31 December 2011.
The 2011 results reflect continued
revenue per available room (RevPAR)
growth, with an overall RevPAR increase
of 6.2%, including a 2.5% increase in
average daily rate. The results also
benefit from overall system size growth
of 1.7% year on year to 658,348 rooms.
RevPar growth remained strong
throughout the year across the Group
although there was some deterioration
in Europe in the fourth quarter reflecting
macroeconomic conditions.
Central overheads increased from $139m
in 2010 to $147m in 2011, driven by
increased investment to support growth
in the business, offsetting non-recurring
bonus costs.
As a result of growth in the business,
together with strong cost control,
operating profit margin was 40.6%, up
4.9 percentage points on 2010, after
adjusting for owned and leased hotels,
The Americas and Europe managed
leases and significant liquidated damages
received in 2011. This growth approximates
to one percentage point after adjusting
for a number of one-off benefits.
During 2011, the IHG global system
increased by 43 hotels (11,187 rooms).
Openings of 241 hotels (44,265 rooms)
were driven by continued expansion in
the US, in particular within the Holiday
Inn brand family and Greater China.
These openings offset the removal of
198 hotels (33,078 rooms). Removals
in the US included 43 hotels (6,994 rooms)
which were removed from the system
as part of the renegotiation of the
management contract with Hospitality
Properties Trust, a major US owner
group. Other openings included the
Venetian and Palazzo resorts, under an
InterContinental Alliance relationship,
(6,986 rooms, included in franchised) as
well as 25 hotels (4,796 rooms) managed
on US army bases.
At the end of 2011, the pipeline totalled
1,144 hotels (180,484 rooms). The
continued global demand for IHG brands
is demonstrated by over 50% of pipeline
rooms being outside of The Americas
region, including 28% in Greater China.
Signings of 356 hotels (55,424 rooms)
represented an increase in the number
of hotels signed from 2010 levels (319
hotels). Momentum for the Hotel Indigo
brand continued into 2011 with 19 signings,
including entry into the Russian market,
as well as the first Hotel Indigo resort in
Phuket, Thailand.
During 2011, the opening of 44,265 rooms
contributed to a net pipeline decline of
24,375 rooms. Active management out
of the pipeline of deals that have become
dormant or no longer viable, resulted in
a further reduction of 35,534 rooms.
AMERICAS RESULTS
Revenue and operating profit before
exceptional items increased by $23m
(2.9%) to $830m and by $82m (22.2%)
to $451m respectively.
Franchised revenue increased by $37m
(8.0%) to $502m. Royalties growth of
8.5% was driven by RevPAR gains across
the estate of 7.2%, including 7.9% for
Holiday Inn Express, and was further
boosted by continued improvement in
the royalty rate achieved. Operating
profit increased by $39m (9.9%) to $431m
also benefiting from lower bad debt
experience.
Managed revenue increased by $5m
(4.2%) to $124m and operating profit
increased by $31m (147.6%) to $52m.
Excluding properties structured for legal
reasons as operating leases but with the
same characteristics as management
contracts, as well as the benefit of a
$10m liquidated damages receipt in 2011
and a $10m year-on-year benefit from
the conclusion of a specific guarantee
negotiation relating to one hotel, revenue
grew by $7m. Growth was driven by a
RevPAR increase of 8.8% across the
estate. Although year-end system size
was 6.0% lower than at the end of 2010,
due to the phasing of removals towards
the end of the year, rooms available
during the year actually grew by 4.5%.
Operating profit grew by $11m on the
same basis, also benefiting from
increased joint venture distributions.
Owned and leased revenue declined by
$19m (8.5%) and operating profit grew
by $4m (30.8%) to $17m. Excluding the
year-on-year impact of hotel disposals,
owned and leased revenue grew by
$8m (4.2%) and operating profit by
$7m (77.8%) reflecting RevPAR growth
of 10.3%, including 11.2% at the
InterContinental New York Barclay.
SUMMARY FINANCIAL STATEMENT
We delivered a 26% growth in operating profit before exceptional items and a five percentage
point increase in operating margin over last year. These results were driven by the strength of our
preferred brands, underpinned by our global systems and scale, resulting in 6.2% RevPAR growth,
beating the industry in key markets such as the US and Greater China, and a 2% increase in hotel
room count.