Holiday Inn 2011 Annual Report Download - page 37
Download and view the complete annual report
Please find page 37 of the 2011 Holiday Inn annual report below. You can navigate through the pages in the report by either clicking on the pages listed below, or by using the keyword search tool below to find specific information within the annual report.-
 1
1 -
2
-
3
-
4
-
5
-
6
-
7
-
8
-
9
-
10
-
11
-
12
-
13
-
14
-
15
-
16
-
17
-
18
-
19
-
20
-
21
-
22
-
23
-
24
-
25
-
26
-
 27
27 -
 28
28 -
 29
29 -
 30
30 -
 31
31 -
 32
32 -
 33
33 -
 34
34 -
 35
35 -
 36
36 -
 37
37 -
 38
38 -
 39
39 -
 40
40 -
 41
41 -
 42
42 -
 43
43 -
 44
44 -
 45
45 -
 46
46 -
 47
47 -
48
-
49
-
50
-
51
-
52
-
53
-
54
-
55
-
56
-
57
-
58
-
59
-
60
 |
 |

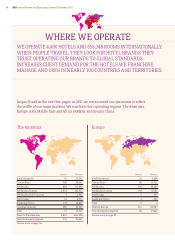
more on the web: www.ihgplc.com Where we operate 35
OVERVIEW GREAT BRANDS HOW WE OPERATE WHERE WE OPERATE FACTS AND FIGURES
Hotels Rooms
InterContinental 64 20,425
Crowne Plaza 61 16,921
Holiday Inn 77 18,032
Holiday Inn Express 8 1,857
Staybridge Suites 2 304
Other 16 3,544
Total for AMEA 228 61,083
Total development pipeline 122 29,584
find out more on page 38
Asia, Middle East and Africa
Hotels Rooms
InterContinental 23 9,911
Crowne Plaza 52 18,456
Holiday Inn 57 17,938
Holiday Inn Express 34 8,693
Hotel Indigo 1 184
Other 0 0
Total for Greater China 167 55,182
Total development pipeline 149 49,768
find out more on page 39
Greater China
4,480 hotels in nearly
100 countries and territories
658,348 rooms globally
1,144 hotels in the pipeline
180,484 rooms in the pipeline