Holiday Inn 2011 Annual Report Download - page 4
Download and view the complete annual report
Please find page 4 of the 2011 Holiday Inn annual report below. You can navigate through the pages in the report by either clicking on the pages listed below, or by using the keyword search tool below to find specific information within the annual report.-
 1
1 -
 2
2 -
 3
3 -
 4
4 -
 5
5 -
 6
6 -
 7
7 -
 8
8 -
 9
9 -
 10
10 -
 11
11 -
 12
12 -
 13
13 -
 14
14 -
 15
15 -
16
-
17
-
18
-
19
-
20
-
21
-
22
-
23
-
24
-
25
-
26
-
27
-
28
-
29
-
30
-
31
-
32
-
33
-
34
-
35
-
36
-
37
-
38
-
39
-
40
-
41
-
42
-
43
-
44
-
45
-
46
-
47
-
48
-
49
-
50
-
51
-
52
-
53
-
54
-
55
-
56
-
57
-
58
-
59
-
60
 |
 |

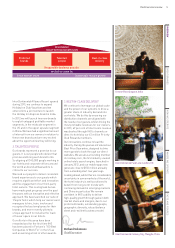
Holiday Inn Phuket, Thailand
2 IHG Annual Review and Summary Financial Statement 2011
Headlines
Total gross revenue
from hotels in IHG’s system
up 8% to $20.2bn*
Revenue up 9%† to $1,768m
Operating profit
before exceptional items:
Group $559m† (2010 $444m)
The Americas $451m† (2010 $369m)
Europe $104m (2010 $78m)
Asia, Middle East and Africa
$84m† (2010 $82m)
Greater China $67m (2010 $54m)
Revenue per available room∞
up 6.2%
Total number of rooms operating
under IHG brands 658,348
(4,480 hotels)
7m new Priority Club
Rewards members added
(63m members in total)
69% of rooms revenue delivered
through IHG’s channels or by
Priority Club Rewards members
direct to hotel
Total dividend
up 15% at 55.0¢
(sterling equivalent of 34.5p)
* Total room revenue from franchised
hotels and total hotel revenue from
managed, owned and leased hotels
(not all attributable to IHG).
† Includes two significant liquidated
damages receipts in 2011; $10m in
The Americas and $6m in Asia,
Middle East and Africa.
∞ Total system rooms revenue divided
by the number of room nights available.